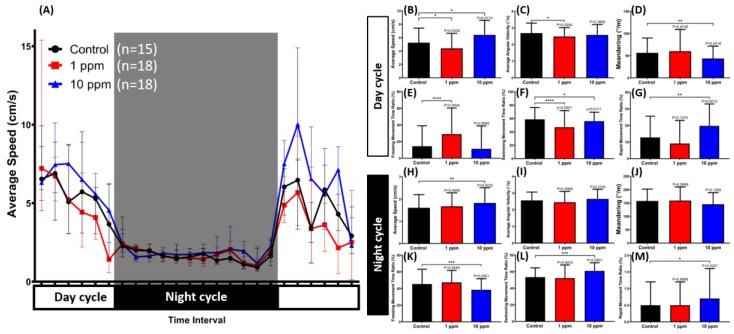
The circadian rhythm assay for Fe3O4 MNPs-exposed zebrafish after 14-day exposure. (A) Comparison of chronological changes of the average speed in light and dark cycles. The grey area shows the dark period while the white area shows the light period. Comparison of the (B) average speed, (C) average angular velocity, (D) meandering, (E) freezing movement time ratio, (F) swimming movement time ratio, and (G) rapid movement time ratio at the light cycle. Comparison of the (H) average speed, (I) average angular velocity, (J) meandering, (K) freezing movement time ratio, (L) swimming movement time ratio, and (M) rapid movement time ratio during the dark cycle. The data are expressed as the median with an interquartile range and were analyzed by a Kruskal-Wallis test, which continued with Dunn’s multiple comparisons test as a follow-up test (n = 15 for control, n = 18 for 1 and 10 ppm MNPs-exposed group, * p < 0.05, ** p < 0.01, *** p < 0.001, **** p < 0.0001).
Acknowledgments
This image is the copyrighted work of the attributed author or publisher, and
ZFIN has permission only to display this image to its users.
Additional permissions should be obtained from the applicable author or publisher of the image.
Full text @ Nanomaterials (Basel)
Your Input Welcome
Thank you for submitting comments. Your input has been emailed to ZFIN curators who may contact you if
additional information is required.
Oops. Something went wrong. Please try again later.