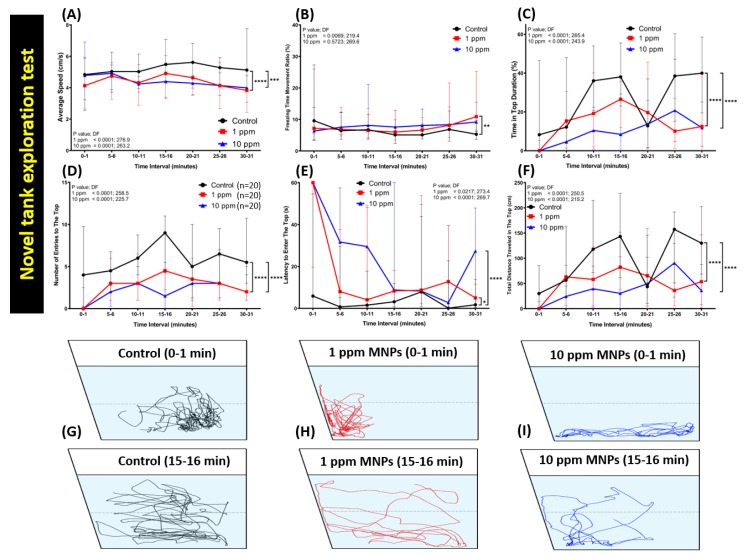
IMAGE

Figure 2

ID
ZDB-IMAGE-191220-49
Source
Figures for Malhotra et al., 2019
Image
Figure Caption

Figure 2

Behavior endpoint of control and Fe3O4 MNPs-exposed zebrafish in novel tank exploration test after two weeks’ exposure. (A) Average speed, (B) freezing time movement ratio, (C) time in top duration, (D) number of entries to the top, (E) latency to enter the top, and (F) total distance traveled in the top were analyzed. (G–I) The locomotion trajectories of control as well as 1 and 10 ppm MNPs-exposed fish in the novel tank test. The black line represents the control group, the red line represents the low concentration MNPs group (1 ppm), and the blue line represents the high concentration MNPs group (10 ppm). The data are expressed as the median with interquartile range and were analyzed by two-way ANOVA with Geisser-Greenhouse correction. To observe the main column (Fe3O4 MNPs) effect, Dunnett’s multiple comparison test was carried out. (n = 20, * p < 0.05, ** p < 0.01, *** p < 0.005, **** p < 0.001).

Acknowledgments
This image is the copyrighted work of the attributed author or publisher, and ZFIN has permission only to display this image to its users. Additional permissions should be obtained from the applicable author or publisher of the image. Full text @ Nanomaterials (Basel)