|
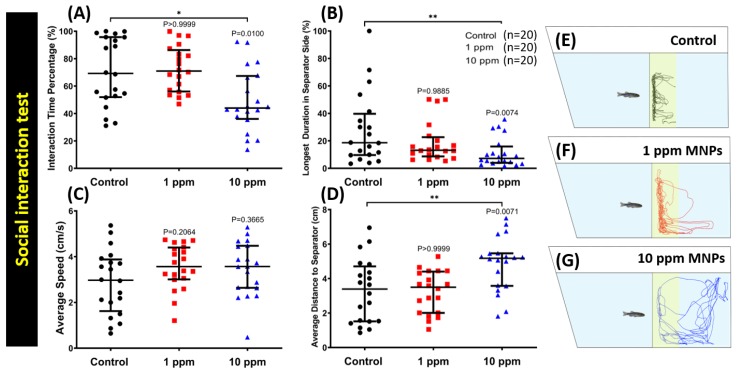
Figure 6
Behavior endpoint comparisons between the control group, 1 ppm, and 10 ppm Fe3O4 MNPs-exposed zebrafish groups after two weeks of exposure. (

|
|
Figure 6
Behavior endpoint comparisons between the control group, 1 ppm, and 10 ppm Fe3O4 MNPs-exposed zebrafish groups after two weeks of exposure. (