
- Title
-
Knock-Down of Histidyl-tRNA Synthetase Causes Cell Cycle Arrest and Apoptosis of Neuronal Progenitor Cells in vivo
- Authors
- Waldron, A., Wilcox, C., Francklyn, C., Ebert, A.
- Source
- Full text @ Front Cell Dev Biol
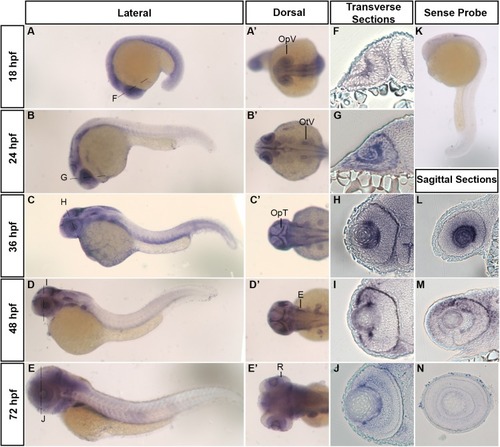
Developmental mRNA expression patterns of zebrafish hars. (A–E) Lateral and (A’–E’) dorsal views of zebrafish embryos at indicated stages, showing harsexpression. (F–J) Transverse sections through the retina (at the level of the dashed lines in A–E). (K) Lateral view of hars sense probe. (L–N) Sagittal sections through the retina. OpV, Optic Vesicle; OtV, Otic Vesicle; OpT, Optic Tectum; E, Ear; R, Retina. EXPRESSION / LABELING:
|
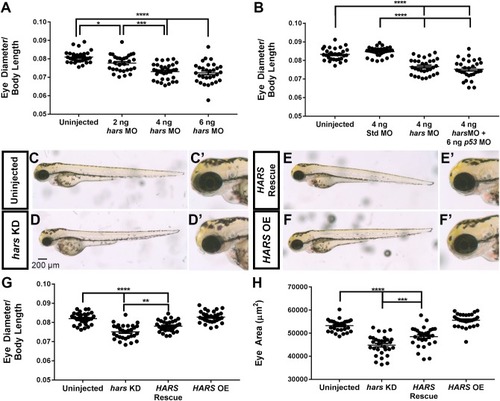
hars knock-down decreases eye size. (A,B) Quantification of eye diameter relative to body length with (A) increasing doses of hars morpholino and (B) standard morpholino and p53 morpholino controls. (C–F’) Brightfield images of 72 hpf embryos. (C,C’) Uninjected, (D,D’) hars MO, (E,E’) hars MO plus human HARSmRNA, and (F,F’) human HARS mRNA alone. (G,H) Quantification of (G) eye diameter relative to body length and (H) eye area of rescue experiment. Ordinary one-way ANOVA followed by Tukey’s multiple comparisons test was performed (n > = 30 ∗= 0.05, ∗∗ = 0.01, ∗∗∗ = 0.001, ∗∗∗∗ = < 0.001); the error bars indicate mean and SEM. PHENOTYPE:
|
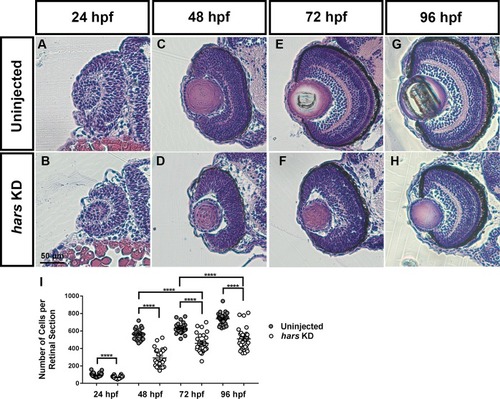
Retinal histology of hars knock-down embryos. (A–H) Images of 7-micron transverse sections taken through uninjected and hars KD embryos at the indicated ages and stained with hematoxylin and eosin. (I) Quantification of cell numbers per central retinal section. Cell counts were analyzed by Student’s t-test (n > = 30 ∗ = 0.05, ∗∗ = 0.01, ∗∗∗ = 0.001, ∗∗∗∗ = < 0.001); the error bars indicate mean and SEM. |
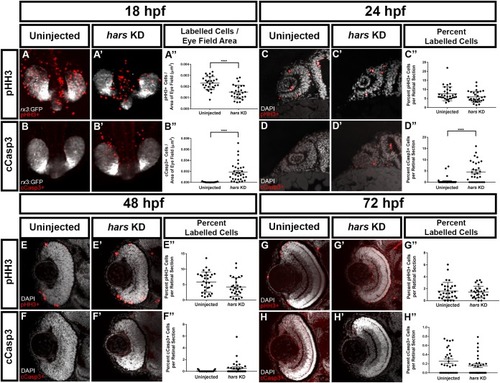
hars KD embryos show reduced proliferation as well as increased cell death of retinal progenitor cells (A–B’) Confocal images of 18 hpf Tg(Rx3:GFP) embryos labeled with (A,A’) the mitotic marker phospho-histone H3 (pHH3) and (B–B”) the apoptosis marker cleaved-caspase3 (cCasp3). (C–H) Single plane confocal images of transverse sections of embryos at (C–D’) 24 hpf, (E–F’) 48 hpf, and (G–H’) 72 hpf labeled with pHH3 or cCasp3 and counterstained with DAPI. (A”–H”) Quantification of (A”–B”) labeled cells per eye vesicle and (C”–H”) labeled cells per retinal section. Student’s t-test (n > = 30 ∗ = 0.05, ∗∗ = 0.01, ∗∗∗ = 0.001, ∗∗∗∗ = < 0.001); error bars indicate mean and SEM. EXPRESSION / LABELING:
PHENOTYPE:
|
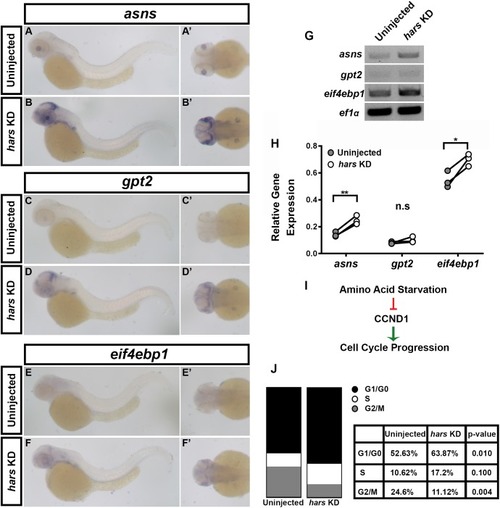
The amino acid starvation response (AASR) is activated in hars KD embryos and results in G1-arrest of retinal progenitor cells. (A–F’) In situ hybridization for three AASR genes in 48 hpf hars KD embryos compared to controls. (G,H) Semi-quantitative RT-PCR for the AASR genes. (H) Quantification of AASR gene expression relative to ef1α in control and hars KD embryos. (I) Schematic showing the relationship between AASR and cell cycle regulation. (J) Results of DNA content analysis on GFP+ cells from 18 hpf (Tg(Rx3:GFP)) uninjected and hars KD embryos. Percentages shown in table are the mean percentages of three replicates. Student’s t-test (n = 3 ∗ = 0.05, ∗∗= 0.01). |
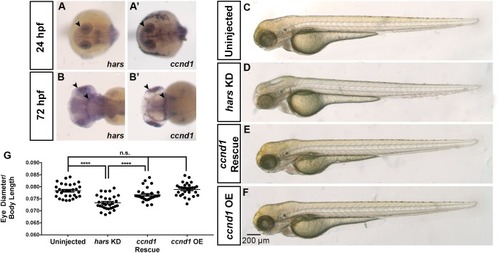
The hars KD phenotype can be rescued by overexpression of ccnd1. (A–B’)mRNA expression of hars and ccnd1 at 24 hpf and 72 hpf. (C–F) Brightfield images of (C) uninjected embryos, (D) embryos injected with hars MO, (E) embryos co-injected with hars MO and zebrafish ccnd1 mRNA, (F) or zebrafish ccnd1 mRNA alone. (G)Quantification of relative eye size at 72 hpf. One-way ANOVA and a multiple comparisons test (n > = 30 ∗ = 0.05, ∗∗ = 0.01, ∗∗∗ = 0.001, ∗∗∗∗ = < 0.001); error bars indicate mean and SEM. EXPRESSION / LABELING:
PHENOTYPE:
|
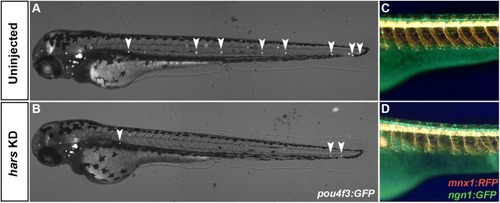
Other neuronal cell populations are affected by hars KD. (A,B) Combined brightfield and fluorescence composite images of Tg(pou4f3:GFP) embryos at 72 hpf labeling neuromasts. (C,D) Fluorescence images from the trunk of [Tg(ngn1:gfp)); Tg(mnx1:rfp) embryos at 72 hpf labeling motor and sensory neurons. PHENOTYPE:
|