
Image
|
Figure Caption
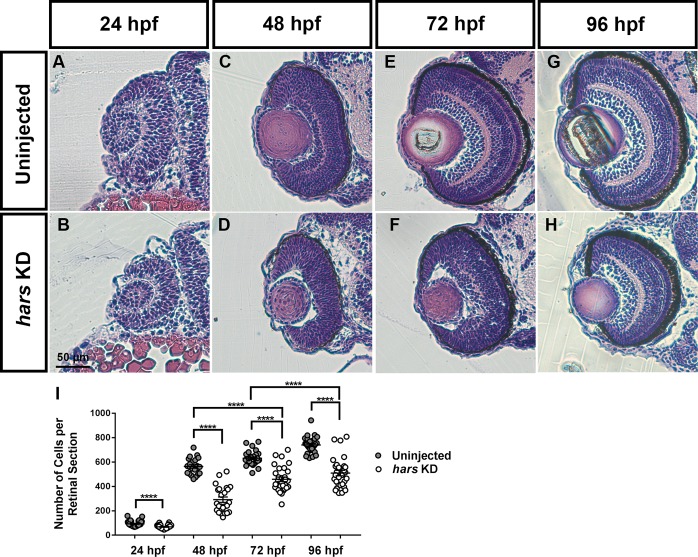
FIGURE 3
Retinal histology of hars knock-down embryos. (A–H) Images of 7-micron transverse sections taken through uninjected and hars KD embryos at the indicated ages and stained with hematoxylin and eosin. (I) Quantification of cell numbers per central retinal section. Cell counts were analyzed by Student’s t-test (n > = 30 ∗ = 0.05, ∗∗ = 0.01, ∗∗∗ = 0.001, ∗∗∗∗ = < 0.001); the error bars indicate mean and SEM.
Figure Data
Acknowledgments
This image is the copyrighted work of the attributed author or publisher, and
ZFIN has permission only to display this image to its users.
Additional permissions should be obtained from the applicable author or publisher of the image.
Full text @ Front Cell Dev Biol