
FIGURE 4
- ID
- ZDB-IMAGE-190723-214
- Genes
- Antibodies
- Publication
- Waldron et al., 2019 - Knock-Down of Histidyl-tRNA Synthetase Causes Cell Cycle Arrest and Apoptosis of Neuronal Progenitor Cells in vivo
- All Figures
- Figures for Waldron et al., 2019
|
FIGURE 4
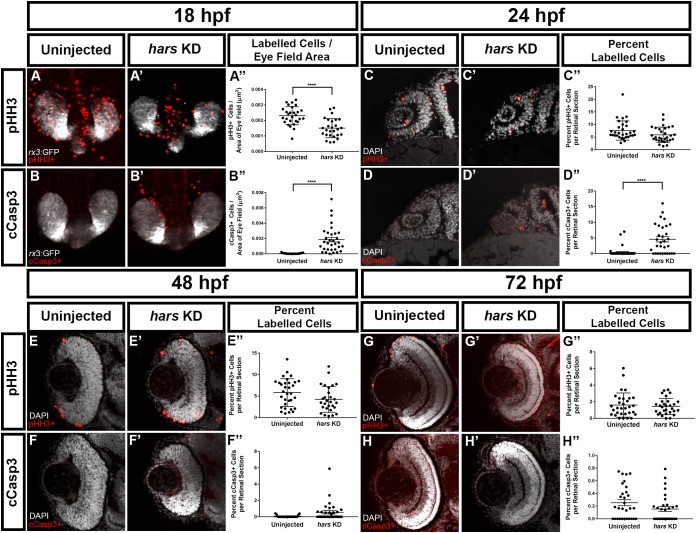
hars KD embryos show reduced proliferation as well as increased cell death of retinal progenitor cells (A–B’) Confocal images of 18 hpf Tg(Rx3:GFP) embryos labeled with (A,A’) the mitotic marker phospho-histone H3 (pHH3) and (B–B”) the apoptosis marker cleaved-caspase3 (cCasp3). (C–H) Single plane confocal images of transverse sections of embryos at (C–D’) 24 hpf, (E–F’) 48 hpf, and (G–H’) 72 hpf labeled with pHH3 or cCasp3 and counterstained with DAPI. (A”–H”) Quantification of (A”–B”) labeled cells per eye vesicle and (C”–H”) labeled cells per retinal section. Student’s t-test (n > = 30 ∗ = 0.05, ∗∗ = 0.01, ∗∗∗ = 0.001, ∗∗∗∗ = < 0.001); error bars indicate mean and SEM.