
- Title
-
A long noncoding RNA cluster-based genomic locus maintains proper development and visual function
- Authors
- Wang, F., Ren, D., Liang, X., Ke, S., Zhang, B., Hu, B., Song, X., Wang, X.
- Source
- Full text @ Nucleic Acids Res.

Characteristics of CNIB1. (A) Phylogenetic tree of CNIB1 genomic locus in the 14 indicated species. (B) Comprehensive view of multiple peak distributions of promoter marker (H3K4me3), enhancer markers (H3K27ac and H3K4me1), insulator marker CTCF and Pol2 binding sites on CNIB1 locus suggest these lncRNAs in CNIB1 are transcribed as independent lncRNAs. The three regions highlighted in turquoise were predicted to be the transcription start sites for CNIB1 lncRNAs. Scale bar: 10kb. (C) Cap assay of indicated CNIB1 lncRNAs. Immunoprecipitation was performed using anti-m2,2,7G antibody or control anti-HA, followed by RT-qPCR detection. Bar plots represent relative enrichment of RNAs immunoprecipitated by the antibody and normalized to GAPDH. (D, E) Northern blotting of CNIB1 lncRNAs in the eyes of mouse (D) and of zebrafish (E) both at 2 months. (F, G) Heatmap of the expression level of CNIB1 lncRNAs. qPCR assays were performed using the brain, eye, heart, and intestine tissues from three 10-week old male mice (F) and six zebrafish (G) at the indicated developmental time points (15, 30, 60 and 120 dpf, respectively), normalized to β-actin. (H) Schematic representation of zebrafish. (I) Whole-mount ISH of five indicated CNIB1 lncRNAs (uc.273+, uc.275+, uc.275-, uc.276+, uc.277+) and pbx3b using corresponding antisense digoxigenin-labeled probes in larval zebrafish (n = 8). The yellow dotted oval marks the area where the eye of zebrafish is located. EXPRESSION / LABELING:
|

ZFIN is incorporating published figure images and captions as part of an ongoing project. Figures from some publications have not yet been curated, or are not available for display because of copyright restrictions. PHENOTYPE:
|
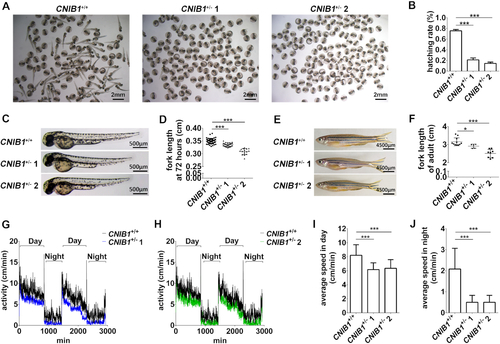
CNIB1+/− zebrafish exhibit developmental retardation and impaired locomotor activity. (A) Representative hatching status of the zebrafish offspring at 48 hpf from CNIB1+/+ (n = 130), CNIB1+/− 1 (n = 130) and CNIB1+/− 2 (n = 130) incross. Scale bars: 2 mm. (B) Schematic representation of A. (C, D) Representative images and the schematic representation of the fork lengths of the zebrafish offspring at 5 dpf from CNIB1+/+ (n = 42), CNIB1+/− 1 (n = 27) and CNIB1+/− 2 (n = 15) incross. Scale bars: 500 μm. (E, F) Representative images and the schematic representation of the fork lengths of the CNIB1+/+ (n = 11), CNIB1+/− 1 (n = 8) and CNIB1+/− 2 (n = 5) adult zebrafish at 4 months. Scale bars: 4500 μm. (G, H) Activity records of the zebrafish offspring at 5 dpf from CNIB1+/+ (n = 16), CNIB1+/− 1 (n = 16) and CNIB1+/− 2 (n = 16) incross at day (G) or night (H). (I, J) The schematic representation of the average locomotion speed gathered from figures G and H, respectively. |
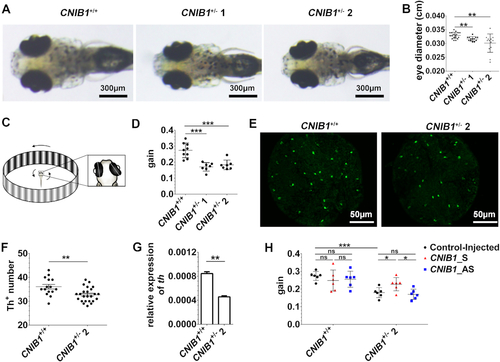
CNIB1 influences visual function in zebrafish. (A) Representative eye images of the zebrafish offspring at 5 dpf from CNIB1+/+, CNIB1+/− 1, and CNIB1+/− 2 incross. Scale bars: 300 μm. (B) The schematic representation of the eye diameters gathered from figure 5A. CNIB1+/+, n = 19, CNIB1+/− 1, n = 13, CNIB1+/− 2, n = 13. (C) Schematic representation of the zebrafish larval optokinetic response (OKR) experiment. (D) The ratio of eye velocity to the angular velocity of the grating (gain value) assayed by OKR in zebrafish offspring at 5 dpf from CNIB1+/+ (n = 9), CNIB1+/− 1 (n = 7), and CNIB1+/− 2 (n = 7) incross. (E) Representative immunofluorescence staining images of the Th positive (Th+) DA neurons shown in the retinas of zebrafish offspring at 5 dpf from CNIB1+/+ and CNIB1+/− 2 incross. Scale bars: 50 μm. (F) The schematic representation of E. CNIB1+/+, n = 15; CNIB1+/− 2, n = 24. (G) The expression levels of th detected by RT-qPCR in zebrafish offspring from CNIB1+/+ (n = 30) and CNIB1+/− 2 (n = 30) incross, normalized to β-actin. (H) The effects of CNIB1 lncRNAs on the OKR assay in the indicated zebrafish offspring. Control-injected CNIB1+/+, n = 6; CNIB1_S-injected CNIB1+/+, n = 6; CNIB1_AS-injected CNIB1+/+, n = 6; Control-injected CNIB1+/− 2, n = 6; CNIB1_S-injected CNIB1+/− 2, n = 6; CNIB1_AS-injected CNIB1+/− 2, n = 6. |
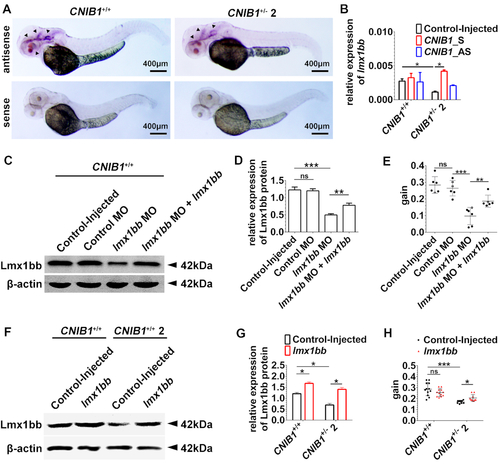
CNIB1 mediates visual function via lmx1bb in zebrafish. (A) In situ hybridization of lmx1bb (indicated by arrowheads) in zebrafish offspring of CNIB1+/+ and CNIB1+/− 2 incross at 48 hpf. Scale bars: 400 μm. (B) Relative expression level of lmx1bb mRNA detected by RT-qPCR in the indicated zebrafish offspring (CNIB1+/+ or CNIB1+/− 2) that were either Control-injected or injected with in vitro transcribed CNIB1 sense (CNIB1_S) or antisense RNAs (CNIB1_AS). The data were normalized to β-actin. (C) Representative images of Western blot for Lmx1bb and β-actin in CNIB1+/+ zebrafish with the indicated modifications. Control MO, mismatch lmx1bb MO; lmx1bb MO, lmx1bb morphants; lmx1bb MO+lmx1bb, co-injection of lmx1bbmorphants and in vitro transcribed lmx1bb mRNA. (D) Quantified expression level of Lmx1bb protein (normalized to β-actin) in the zebrafish shown in C, n is 30 in each group. (E) Gain value of the OKR assay in the zebrafish shown in C. Control-injected, n = 6; Control MO, n = 6; lmx1bb MO, n = 6; lmx1bb MO + lmx1bb, n = 6. (F) Representative images of Western blot for Lmx1bb and β-actin in zebrafish offspring from either CNIB1+/+ or CNIB1+/− 2 incross with the indicated modifications. lmx1bb, injection with in vitro transcribed lmx1bbmRNA. (G) Quantified expression levels of Lmx1bb protein (normalized to β-actin) in the zebrafish shown in F, n = 20. (H) Gain value of the OKR assay in the zebrafish shown in F. Control-injected CNIB1+/+, n = 12; lmx1bb CNIB1+/+, n = 12; Control-injected CNIB1+/− 2, n = 9; lmx1bb CNIB1+/− 2, n = 10. |
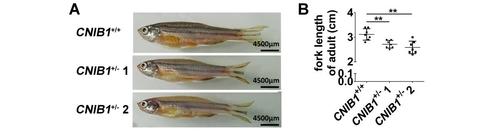
F1 CNIB1+/-adult zebrafish exhibited developmental retardation. (A) Representative images and (B) the schematic representation of the fork lengths of the CNIB1+/+ (n=7), CNIB1+/- 1 (n=7) and CNIB1+/- 2 (n=7). All the zebrafish were F1 adult fish at 4 months. Scale bars: 4500 μm. PHENOTYPE:
|

Representative DAPI staining images of the retinal structures shown in the zebrafish offspring at 5 dpf from CNIB1+/+ and CNIB1+/- 2 incross (n=6). Scale bars: 50 μm. GCL: ganglion cell layer; INL: inner nuclear layer; ONL: outer nuclear layer; RPE: retinal pigment epithelium. |
|
ZFIN is incorporating published figure images and captions as part of an ongoing project. Figures from some publications have not yet been curated, or are not available for display because of copyright restrictions. EXPRESSION / LABELING:
PHENOTYPE:
|