
|
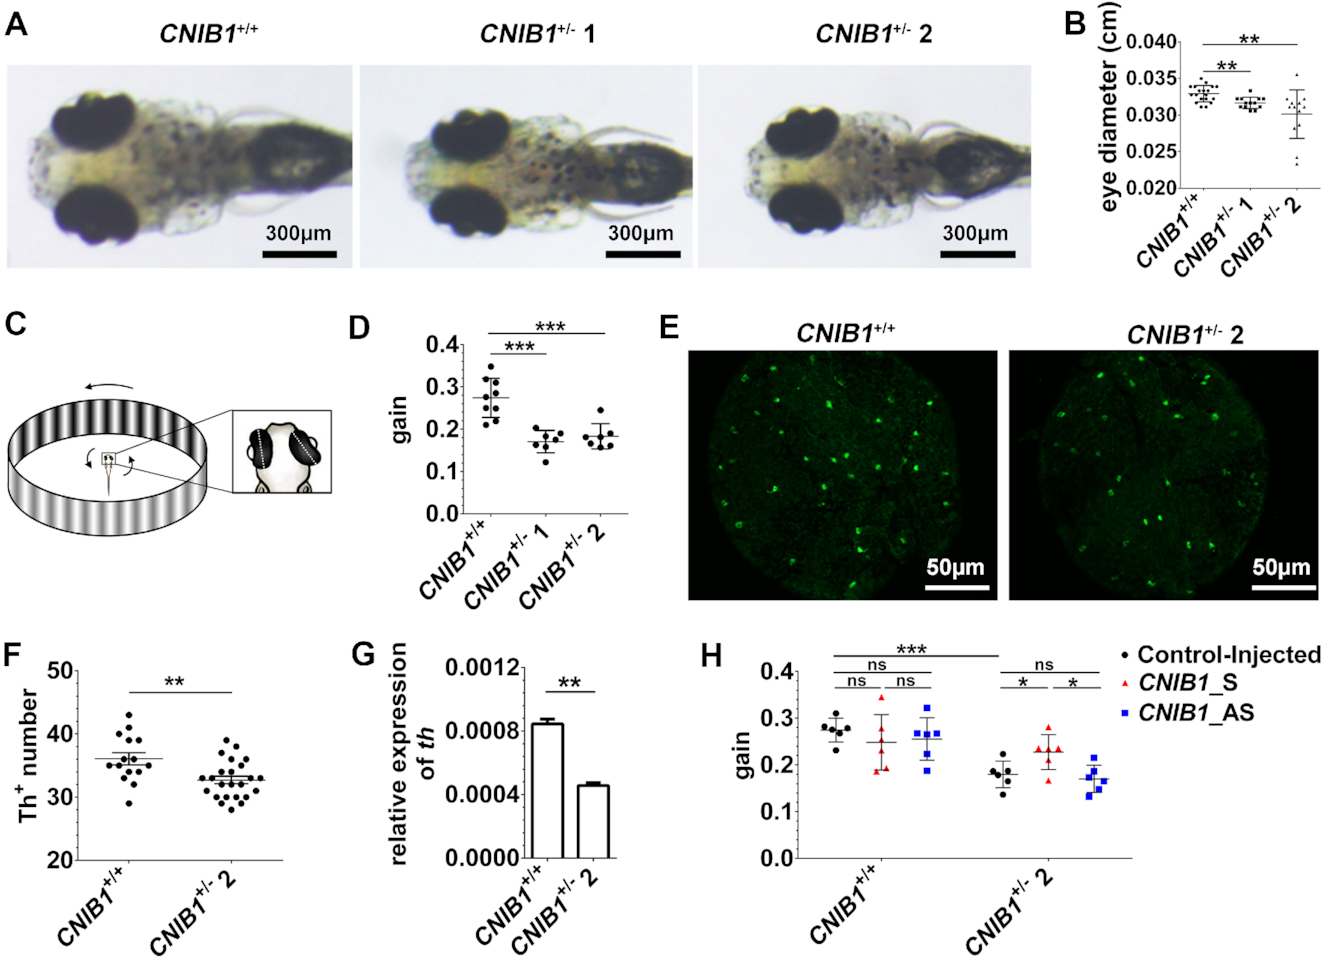
Fig. 5
CNIB1 influences visual function in zebrafish. (A) Representative eye images of the zebrafish offspring at 5 dpf from CNIB1+/+, CNIB1+/− 1, and CNIB1+/− 2 incross. Scale bars: 300 μm. (B) The schematic representation of the eye diameters gathered from figure 5A. CNIB1+/+, n = 19, CNIB1+/− 1, n = 13, CNIB1+/− 2, n = 13. (C) Schematic representation of the zebrafish larval optokinetic response (OKR) experiment. (D) The ratio of eye velocity to the angular velocity of the grating (gain value) assayed by OKR in zebrafish offspring at 5 dpf from CNIB1+/+ (n = 9), CNIB1+/− 1 (n = 7), and CNIB1+/− 2 (n = 7) incross. (E) Representative immunofluorescence staining images of the Th positive (Th+) DA neurons shown in the retinas of zebrafish offspring at 5 dpf from CNIB1+/+ and CNIB1+/− 2 incross. Scale bars: 50 μm. (F) The schematic representation of E. CNIB1+/+, n = 15; CNIB1+/− 2, n = 24. (G) The expression levels of th detected by RT-qPCR in zebrafish offspring from CNIB1+/+ (n = 30) and CNIB1+/− 2 (n = 30) incross, normalized to β-actin. (H) The effects of CNIB1 lncRNAs on the OKR assay in the indicated zebrafish offspring. Control-injected CNIB1+/+, n = 6; CNIB1_S-injected CNIB1+/+, n = 6; CNIB1_AS-injected CNIB1+/+, n = 6; Control-injected CNIB1+/− 2, n = 6; CNIB1_S-injected CNIB1+/− 2, n = 6; CNIB1_AS-injected CNIB1+/− 2, n = 6.