
- Title
-
Stem cell proliferation is induced by apoptotic bodies from dying cells during epithelial tissue maintenance
- Authors
- Brock, C.K., Wallin, S.T., Ruiz, O.E., Samms, K.M., Mandal, A., Sumner, E.A., Eisenhoffer, G.T.
- Source
- Full text @ Nat. Commun.
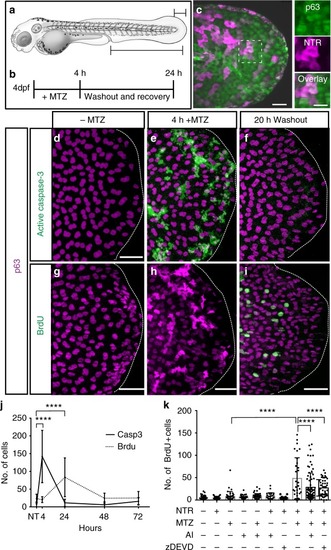
Caspase-dependent proliferation after stem cell ablation. |
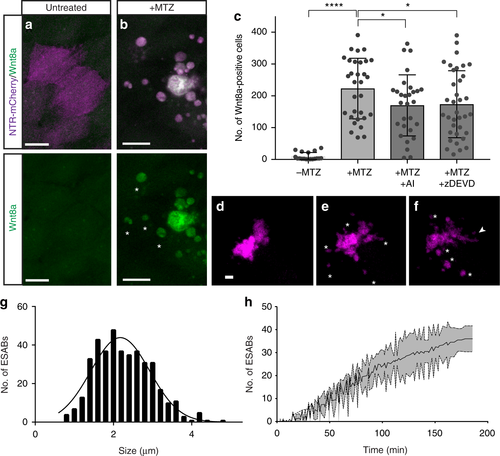
Caspase-dependent generation of Wnt8a in apoptotic cells and bodies. a, b Maximum intensity projections of confocal images of Wnt8a in healthy and apoptotic stem cells (scale = 10 µm). c Mean number of Wnt8a-positive cells in individual larvae after induced apoptosis (n = 31), and in combination with treatment of AI (n = 29) or zDEVD (n = 36). Data are from three independent experiments and error bars represent sd. d–f Still images from time-lapse microscopy of an individual apoptotic cell over time (scale = 5 µm), asterisks mark apoptotic bodies and arrowheads mark filopodia extensions (see Supplementary Movie 1). g Size distribution of epithelial stem cell-derived apoptotic bodies. hQuantification of the production of apoptotic bodies from individual cells. Data from at least three independent experiments are represented as mean ± sd. ****p < 0.0001, *p < 0.03, One-way analysis of variance (ANOVA) with Holm–Sidak multiple comparisons test (c) |
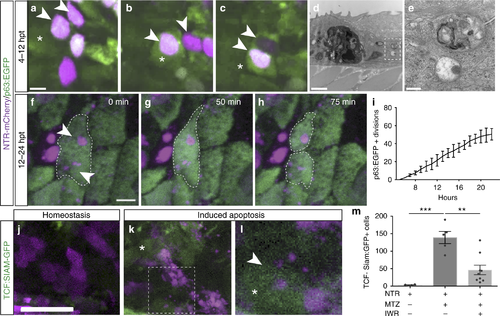
Apoptotic body uptake stimulates Wnt signaling and stem cell division. a–c Confocal maximum intensity projections from time-lapse imaging of a p63-positive cell (green), asterisk, engulfing two apoptotic bodies (magenta), arrowheads (scale = 5 µm), see Supplementary Movie 2. d, e Transmission electron micrographs of apoptotic bodies in adjacent basal cells (scale = 2 µm, 500 nm). f–h Time-lapse imaging of a dividing p63:EGFP-positive stem cell that has engulfed apoptotic bodies (arrowheads; scale = 5 µm), see Supplementary Movie 3. i Quantitation of actively dividing p63:EGFP-positive epithelial stem cells over time after induced apoptosis. j–l Confocal images of Wnt-responsive cells (TCF-Siam:GFP positive) after apoptosis. Arrowheads denote increased Wnt activity in a cell engulfing apoptotic bodies (scale = 50 µm). m Mean number of TCF-Siam:GFP-positive cells from individual larvae after stem cell ablation ( n = 5) and treatment with the Wnt inhibitor IWR-1 ( n = 9). Data are from three independent experiments and error bars represent sem; *** p < 0.0001, ** p < 0.0007. One-way analysis of variance (ANOVA) with Dunnett’s mutiple comparisons test (m) |
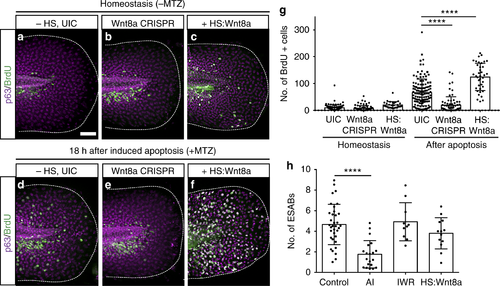
ESAB (epithelial stem cell-derived apoptotic body)-delivered Wnt8a is required for apoptosis-induced stem cell division. a–f Maximum intensity projections of confocal images for bromodeoxyuridine (BrdU) (green) and p63 (magenta) after perturbation of Wnt8a signaling (a–c), and in combination with induction of apoptosis (d–f) (scale = 50 µm). g Mean number of BrdU-positive cells from individual larvae after perturbation of Wnt8a (n = 9) and in combination with induced apoptosis (n = 10). h Quantitative analysis of ESAB production from controls (n = 35) and after treatment with apoptosis inhibitor (AI) (n = 20), the Wnt inhibitor IWR (n = 10) or overexpression of Wnt8a (n = 13). Data are represented as mean ± sd; ****p < 0.0001. One-way analysis of variance (ANOVA) with Dunnett’s mutiple comparisons test (g, h) PHENOTYPE:
|
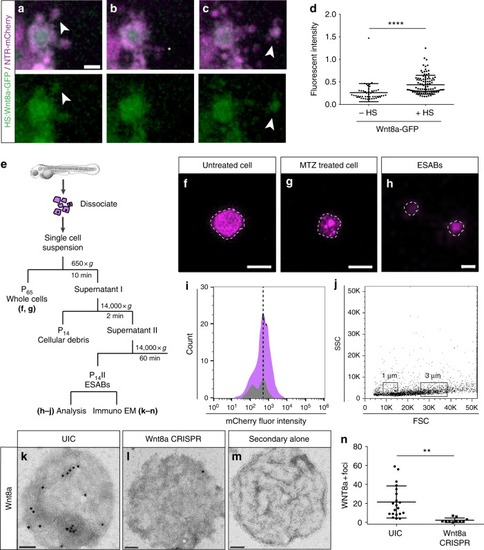
Apoptosis-induced stem cell division requires Wnt8a on the surface of ESABs (epithelial stem cell-derived apoptotic bodies). |

ZFIN is incorporating published figure images and captions as part of an ongoing project. Figures from some publications have not yet been curated, or are not available for display because of copyright restrictions. |