IMAGE

Fig. 1

ID
ZDB-IMAGE-190723-1551
Source
Figures for Brock et al., 2019
Image
Figure Caption

Fig. 1

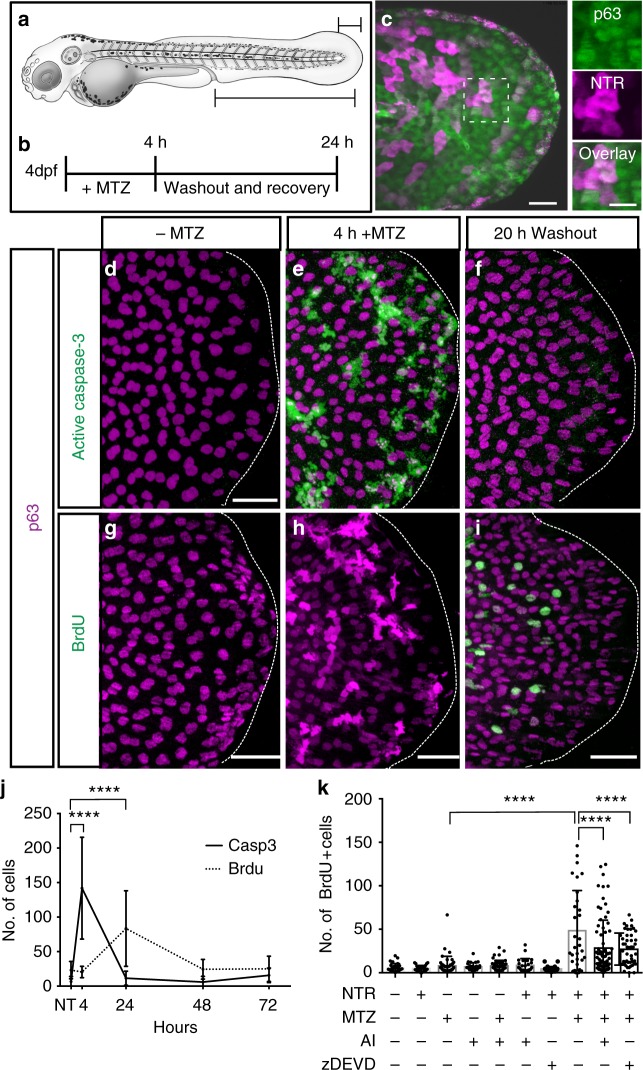
Caspase-dependent proliferation after stem cell ablation. a Schematic of a 4-day post-fertilization (dpf) zebrafish larvae. Large region denotes area of the animal where cell death and proliferation were quantified before and after cell ablation. Small region marks the area used for fixed and live imaging. b Timeline for the addition and removal of metronidazole (MTZ). c The zc1036a GAL4 enhancer trap line drives expression of fluorescently tagged nitroreductase (NTR) in a subset of p63-positive basal stem cells (scale = 100 µm, 50 µm inset). Maximum intensity projections of confocal images for activated caspase-3 (df) and bromodeoxyuridine (BrdU) (gi) at different points after inducing damage (scale = 50 µm). j Quantification of active caspase-3- and BrdU-positive cells reveals a temporal relationship for the proliferative response. Mean number of positive cells from at least n = 11 individual larvae across three independent experiments per time point are plotted. NT=No treatment. k Mean number of BrdU-positive cells in individual larvae after induced apoptosis (n = 31) and in combination with treatment of the apoptosis inhibitor, NS3694 (AI) (n = 77) or caspase-3 peptide inhibitor zDEVD-fmk (zDEVD) (n = 49). Data are from three independent experiments and error bars represent sd; ****p < 0.0001. One-way analysis of variance (ANOVA) with Dunnett’s mutiple comparisons test (j, k)

Figure Data
Acknowledgments
This image is the copyrighted work of the attributed author or publisher, and ZFIN has permission only to display this image to its users. Additional permissions should be obtained from the applicable author or publisher of the image. Full text @ Nat. Commun.