
Fig. 2
- ID
- ZDB-IMAGE-200224-8
- Genes
- Antibodies
- Publication
- Brock et al., 2019 - Stem cell proliferation is induced by apoptotic bodies from dying cells during epithelial tissue maintenance
- All Figures
- Figures for Brock et al., 2019
|
Fig. 2
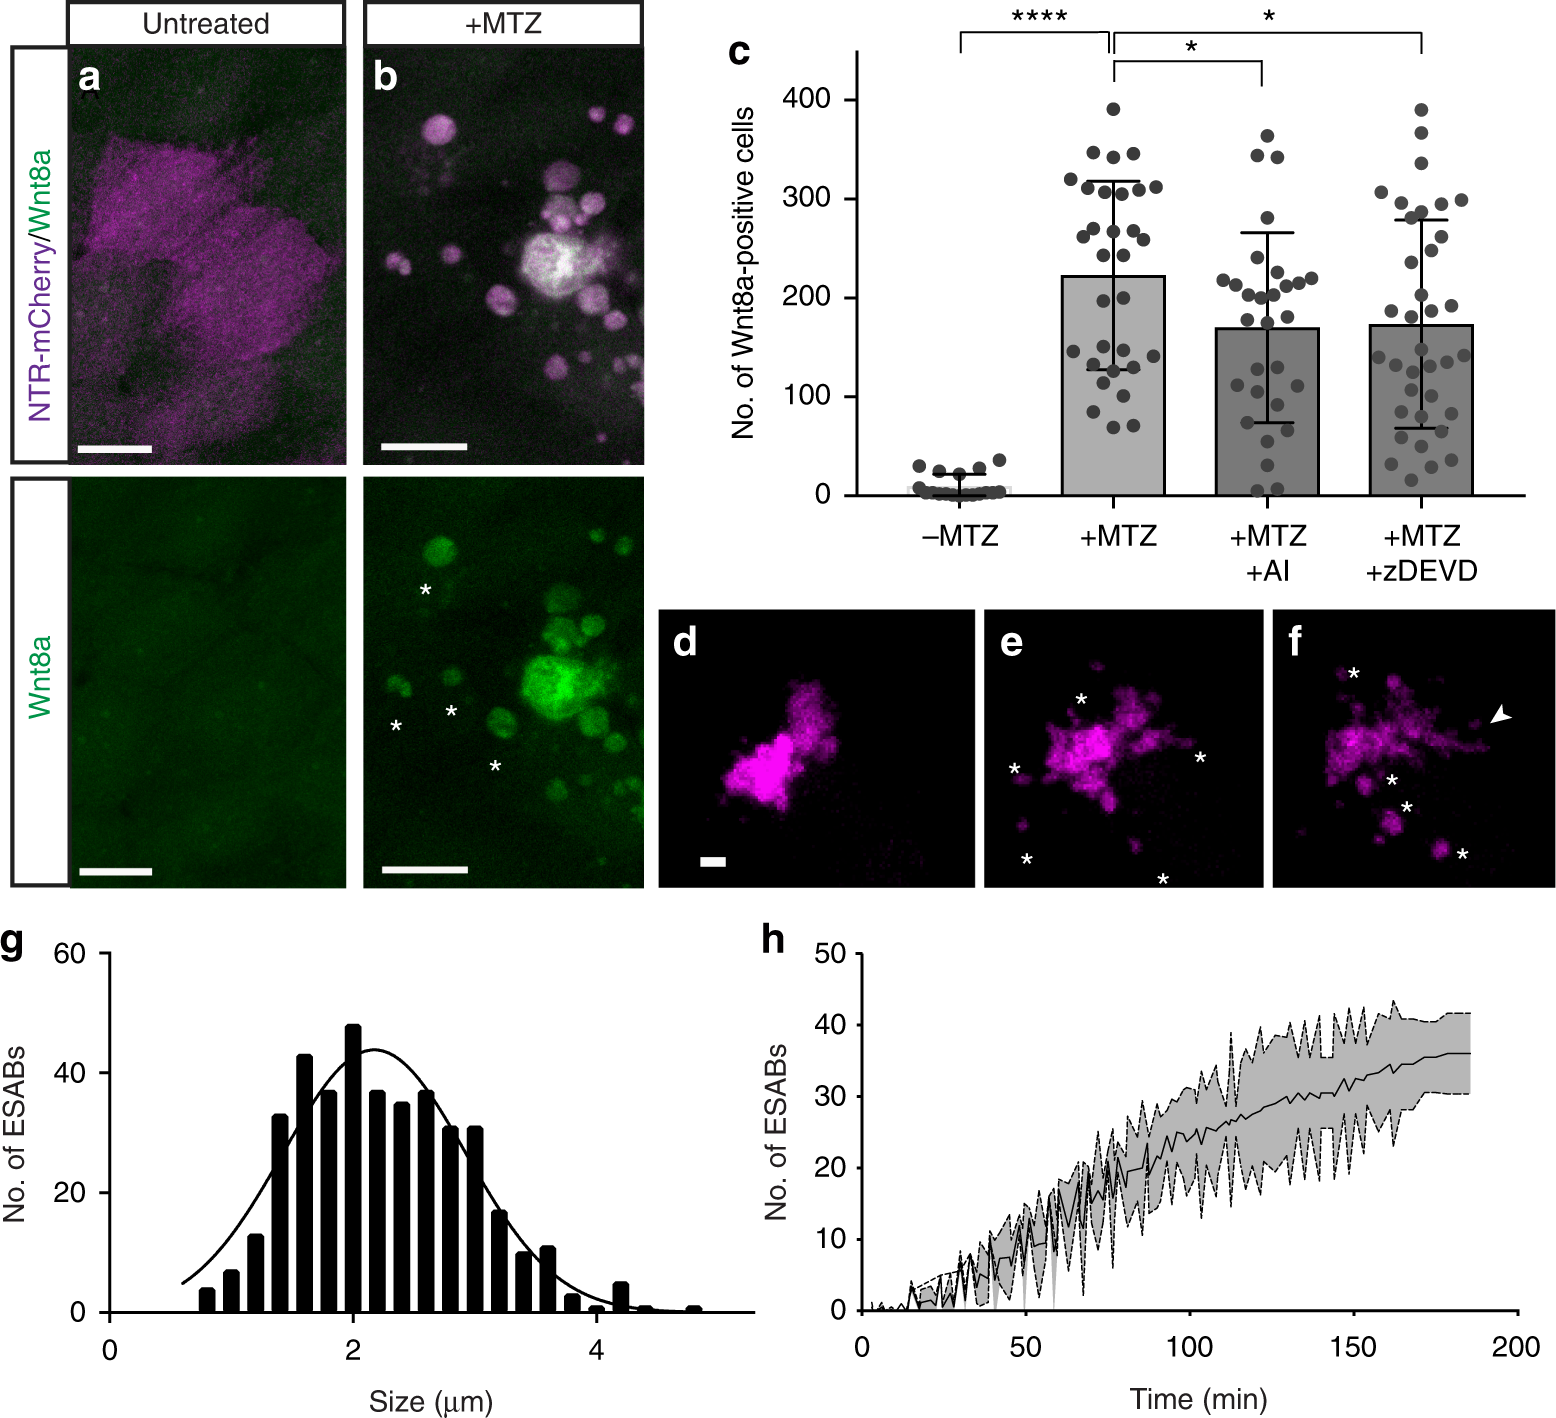
Caspase-dependent generation of Wnt8a in apoptotic cells and bodies. a, b Maximum intensity projections of confocal images of Wnt8a in healthy and apoptotic stem cells (scale = 10 µm). c Mean number of Wnt8a-positive cells in individual larvae after induced apoptosis (n = 31), and in combination with treatment of AI (n = 29) or zDEVD (n = 36). Data are from three independent experiments and error bars represent sd. d–f Still images from time-lapse microscopy of an individual apoptotic cell over time (scale = 5 µm), asterisks mark apoptotic bodies and arrowheads mark filopodia extensions (see Supplementary Movie 1). g Size distribution of epithelial stem cell-derived apoptotic bodies. hQuantification of the production of apoptotic bodies from individual cells. Data from at least three independent experiments are represented as mean ± sd. ****p < 0.0001, *p < 0.03, One-way analysis of variance (ANOVA) with Holm–Sidak multiple comparisons test (c)