
- Title
-
Mesencephalic origin of the inferior lobe in zebrafish
- Authors
- Bloch, S., Thomas, M., Colin, I., Galant, S., Machado, E., Affaticati, P., Jenett, A., Yamamoto, K.
- Source
- Full text @ BMC Biol.
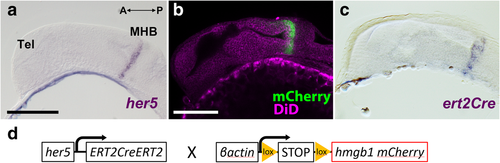
Verification of the expression profile of the zebrafish transgenic line used in this study. a–c Sagittal sections of 24 hpf embryos showing that expression of her5 and ert2Cre is restricted to the MHB. The anterior part of the embryo is on the left. a In situ hybridization (ISH) of her5 confirms its specific expression in the MHB (purple). b Expression of mCherry (green) in a transgenic line Tg(her5:mCherry), which is identical to the her5 ISH pattern. The morphology is shown with DiD fiber labeling (magenta). c The expression pattern of ert2Cre is also identical to the her5 ISH (a) and mCherry in Tg(her5:mCherry) (b). d A simplified schema of the constructs of Tg(her5:ERT2CreERT2)and Tg(βact:lox-stop-lox-hmgb1:mCherry) which were used in this cell lineage study. Scale bars, 100 μm. Abbreviations: MHB midbrain-hindbrain boundary, Tel telencephalon |
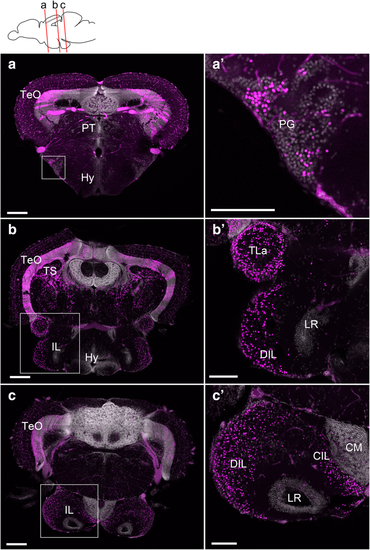
Localization of the mCherry-positive cells in the adult brain of Tg(her5:ERT2CreERT2;βact:lox-stop-lox-hmgb1:mCherry) zebrafish treated with tamoxifen at 24 hpf. a–c Confocal images of frontal sections showing global views of the mCherry distribution (Z-projection, 5 μm for a and 10 μm for b and c). The mCherry-positive cells are shown in magenta, and DAPI nuclear labeling is shown in gray. The plane of each section is indicated in the schematic drawing on the top. a’–c’ Higher magnifications of the areas squared in a–c, showing the preglomecular nucleus (PG; a’) and the inferior lobe (IL; b’, c’). Abbreviations: CM corpus mamillare, CIL central nucleus of the inferior lobe, DIL diffuse nucleus of the inferior lobe, Hy hypothalamus, IL inferior lobe, LR lateral recess, PG preglomerular nucleus, PT pretectum, TeO optic tectum, TLa torus lateralis, TS torus semicircularis. Scale bars: a–c, 200 μm; a’–c’, 100 μm |

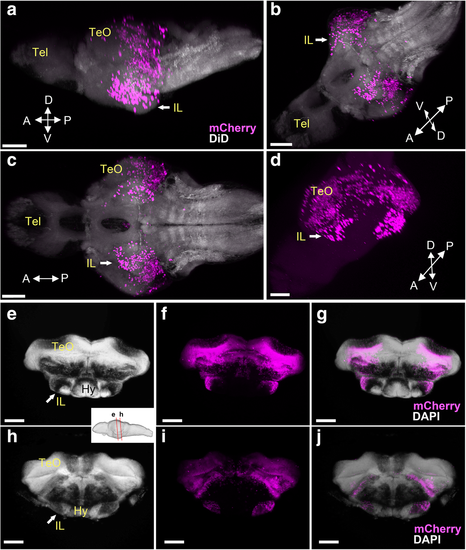
Localization of the mCherry-positive cells in young larval brains of Tg(her5:ERT2CreERT2;βact:lox-stop-lox-hmgb1:mCherry) zebrafish treated with tamoxifen at 24 hpf. Anterior to the left for a–d, e, h, and j. a–d 3D reconstruction from confocal images of a whole head of 3 dpf larva. mCherry-positive cells are shown in magenta, and YOYO-1, a nuclear marker, is shown in green. a, b Side view of the larval head with (a) and without (b) YOYO-1 labeling. c, d Top view of the larval head with (c) and without (d) YOYO-1 labeling. The mCherry-positive cells are still close to the MHB at this stage. Some cells are starting to migrate anteriorly, but there are no mCherry-positive cells in the forebrain or in other brain areas. e–k 3D reconstruction from confocal images of dissected brains of 3 dpf (e–g), 5 dpf (h, i), and 7 dpf (j, k) larvae. mCherry-positive cells are shown in magenta, and DiD fiber labeling is shown in gray. e A whole brain at 3 dpf is shown in lateral view. f A sagittal section through the same specimen. g A frontal section. The hypothalamus (Hy) is extending in ventral position below the midbrain and is devoid of mCherry-positive cells. h A whole brain at 5 dpf is shown in lateral view. i A frontal section from the same brain showing the first appearance of the inferior lobe (IL; arrow), with a few mCherry-positive cells at the periphery of the structure. j A whole brain at 7 dpf is shown in lateral view. k A frontal section from the same brain showing the growing IL (arrow), with more mCherry-positive cells added laterally. Abbreviations: Cb cerebellum, Hy hypothalamus, IL inferior lobe, TeO optic tectum, Tel telencephalon. Scale bars: a–d, 100 μm. e–k, 50 μm |
Localization of the mCherry-positive cells in late larval brains of Tg(her5:ERT2CreERT2;βact:lox-stop-lox-hmgb1:mCherry) zebrafish treated with tamoxifen at 24 hpf. a–d 3D reconstruction from confocal images of a 14 dpf brain, showing mCherry-positive cells in magenta (a–d) and DiD fiber labeling in gray (a–c). Four different views are presented: lateral (a), ventral (c), and two different obliques (b, d). Arrows point at the IL on one hemisphere. The IL bulging can be seen in a and b, while d displays the continuity of the mCherry-positive cells in the IL with other midbrain structures. e–j Frontal sections of a 19 dpf brain, showing mCherry-positive cells in magenta and DAPI nuclear labeling in gray. IL is clearly visible in frontal sections (arrows), at two different antero-posterior levels (indicated in sagittal view in the white box). Anteriorly (e–g) the mCherry-positive cells are on the lateral part of IL that appears continuous with more dorsal midbrain structures, while posteriorly (h–j) a cluster of the mCherry-positive cells is seemingly detached from the dorsal midbrain structures. At the posterior IL, most of the IL is mCherry positive. Scale bars, 80 μm. Abbreviations: Hy hypothalamus, IL inferior lobe, TeO optic tectum, Tel telencephalon |
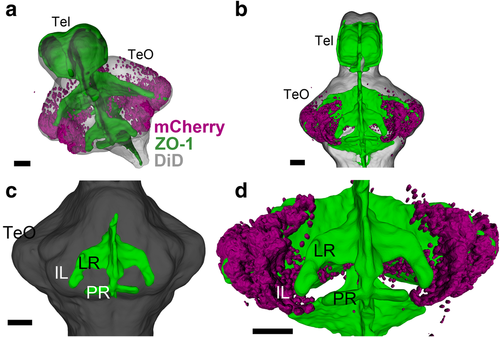
Developing IL in relation to the ventricular morphology. 3D reconstruction of image segmentation from confocal images of a 14 dpf zebrafish brain. ZO-1 (ventricular labeling) is shown in green (a–d), mCherry-positive cells are shown in magenta (a, b, d), and DiD fiber labeling is shown in gray (a–c). a, b Oblique (a) and ventral (b) views of the brain, showing the general distribution of the mCherry-positive cells in relation to the ventricular organization. c A ventral view highlighting the lateral recess (LR) and the posterior recess (PR) (anterior of the brain to the top). d A higher magnification of bfocusing on the mCherry cells in relation to the LR. The mCherry cells are continuous from the tectal region, but they are devoid of proximity of the ventricular zone. Scale bars, 50 μm. Abbreviations: IL inferior lobe, LR lateral recess, PR posterior recess, Tel telencephalon, TeO optic tectum |
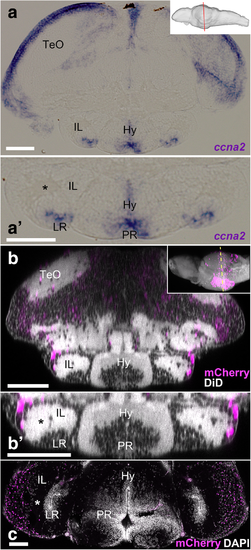
Comparison of juvenile and adult IL in zebrafish. a, a’ Frontal section of the 14 dpf brain showing the transcripts of ccna2. The plane of the section is indicated in sagittal view in the right upper corner. a’ A higher magnification of the ventral part of a containing IL. The expression of ccna2 is found around LR. b, c Brains of Tg(her5:ERT2CreERT2;βact:lox-stop-lox-hmgb1:mCherry) zebrafish treated with tamoxifen at 24 hpf. b, b’ Frontal view of the 14 dpf brain which was obtained from 3D reconstruction of confocal images, showing mCherry-positive cells in magenta and DiD fiber labeling in gray. The plane of the section is indicated in sagittal view in the right upper corner. b’ A higher magnification of the ventral part of b containing IL. c Frontal section of the adult IL showing mCherry-positive cells in magenta and DAPI nuclear labeling in gray. Note that the gray represents DiD fiber labeling in b and b’, while it corresponds to DAPI nuclear labeling in c. The asterisks indicate the cell-free fiber zone that separates the mCherry-positive external zone and the ventricular zone (around LR). The mCherry-positive cells are much abundant in the adult IL than in the larval IL. Scale bar, 90 μm. Abbreviations: Hy hypothalamus, IL inferior lobe, LR lateral recess, PR posterior recess, TeO optic tectum |

Localization of her5 progenies following the induction at juvenile stages. a–i The brains of Tg(her5:mCherry) zebrafish to indicate the her5 expression at late larval to juvenile stages. j–o The brains of Tg(her5:ERT2CreERT2;βact:lox-stop-lox-hmgb1:mCherry) to indicate their progenies in the adult (3 mpf) brains. a–c 3D reconstruction from confocal images of a 14 dpf brain, showing mCherry (representing her5 expression) in green and DiD fiber labeling in magenta. Yellow arrows indicate the anterior her5-expressing domain, while blue arrows indicate the posterior her5-expressing domain. aThe whole brain in lateral view, b in ventral view, and c in a frontal section from the same 3D visualization. d–i Frontal sections of juvenile brains of Tg(her5:mCherry) (d, e at 4 wpf, f, g at 6 wpf, and h, i at 8 wpf), showing mCherry (representing her5 expression) in magenta and DAPI nuclear labeling in gray. The right half of the brain is demonstrated without DAPI to better visualize the mCherry signals. d, f, h The sections containing the anterior her5-expressing domain (yellow arrows). e, g, i The sections containing the posterior her5-expressing domain (blue arrows). j–o Frontal sections of 3 mpf brains of Tg(her5:ERT2CreERT2;βact:lox-stop-lox-hmgb1:mCherry), after tamoxifen induction at the corresponding juvenile stages (j, k are the brain induced at 4 wpf, l, m at 6 wpf, and n, o at 8 wpf). j, l, n The sections showing the anterior IL. k, m, o The posterior IL. Note that the mCherry labelings (magenta) in these sections represent progenies of the cells shown in d–i. Scale bar: a–c, 50 μm; d–g 100 μm; h, i 200 μm; j–o, 350 μm. Abbreviations: Cb cerebellum, Hy hypothalamus, IL inferior lobe, Tel telencephalon, TeO optic tectum |
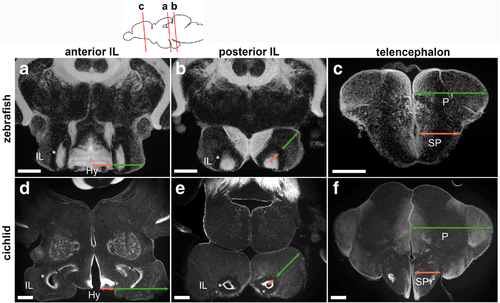
Comparison of the zebrafish and cichlid brains. Frontal sections of the brains of zebrafish (a–c) and cichlid (d–f), showing DAPI nuclear labeling in gray. The plane of the zebrafish sections is indicated in the schematic drawing on the top, and comparable level of the cichlid brain is shown below each zebrafish section. a, d Anterior IL. b, e The posterior IL. c, f The telencephalon. The relative size of the cichlid IL (d, e) is much larger than that of the zebrafish IL (a, b). It is prominent in comparison with the size of the hypothalamus (Hy; the size indicated in red arrows in a and d) that is located medial to the IL (the size indicated in green arrows in a and d). Also, the relative size of the external zone (the size indicated in green arrows in b and e) in comparison with the internal ventricular zone (the size indicated in red arrows in b and e) is much larger in cichlid. The asterisks (*) in a, b, d, and e indicate a cell-free fiber zone separating the external and internal zones. The relative size of the pallium (P; the size indicated in green arrows in c and f) in comparison with the subpallium (SP; the size indicated in red arrows in c and f) is much larger in cichlid than in zebrafish. Scale bar: a-c, 200 μm; d–f, 350 μm. Abbreviations: Hy hypothalamus, IL inferior lobe, P pallium, SP subpallium |
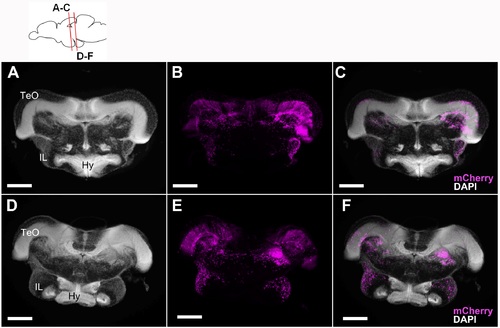
Localization of the mCherry-positive cells in the 5 wpf juvenile brain of Tg(her5:ERT2CreERT2;βact:lox-stop-lox-hmgb1:mCherry) zebrafish treated with tamoxifen at 24 hpf. Frontal sections showing mCherry-positive cells in magenta and DAPI nuclear labeling in gray. A-C show the anterior IL and D-E show more posterior IL. Scale bars: 100 μm. Abbreviations, Hy: hypothalamus, IL: inferior lobe, TeO: optic tectum. (TIF 10750 kb) |
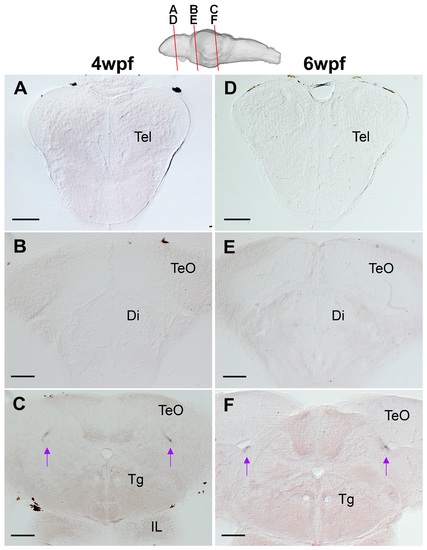
Endogenous expression of her5 in juvenile zebrafish brains. In situ hybridization of her5 on frontal sections of 4 wpf (A-C) and 6 wpf (D-F) brains. The plane of each section is indicated in the schematic drawing on the top. There is no her5expression in the anterior sections containing forebrain regions (A, B, D, E). In the brain sections containing the mesencephalic region, her5 expression is found along the tectal ventricular zone (C, F; arrows). Scale bar: 100 μm. Abbreviation, Di: diencephalon, IL: inferior lobe, Tel: telencephalon, TeO: optic tectum, Tg: tegmentum. (TIF 17072 kb) |
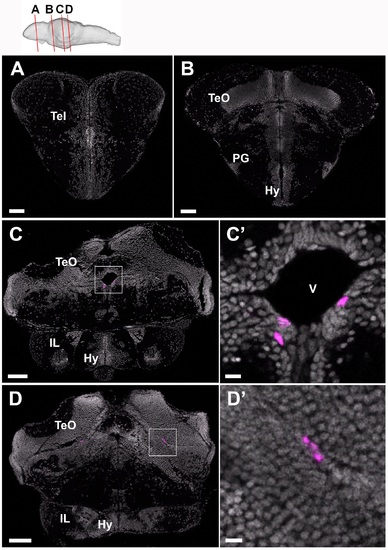
Short-term tracing of tamoxifen-induced mCherry-positive cells in the Tg(her5:ERT2CreERT2;βact:lox-stop-lox-hmgb1:mCherry) juvenile zebrafish brain. Frontal sections of a 4 wpf brain, showing mCherry-positive cells in magenta and DAPI nuclear labeling in gray. The plane of each section is indicated in the schematic drawing on the top. A, B Anterior brain sections containing forebrain regions where there is no mCherry-positive cell. C, D More posterior brain sections containing mesencephalic regions where a few mCherry-positive cells are found close to the tectal ventricular zone. C’ and D’ show the area squared in C and D at a higher magnification. Scale bar: 60 μm for A and B, 100 μm for C and D, and 10 μm for C’ and D’. Abbreviation, Hy: hypothalamus, IL: inferior lobe, PG: preglomerular nucleus, Tel: telencephalon, TeO: optic tectum, V: ventricle. (TIF 18788 kb) |