
|
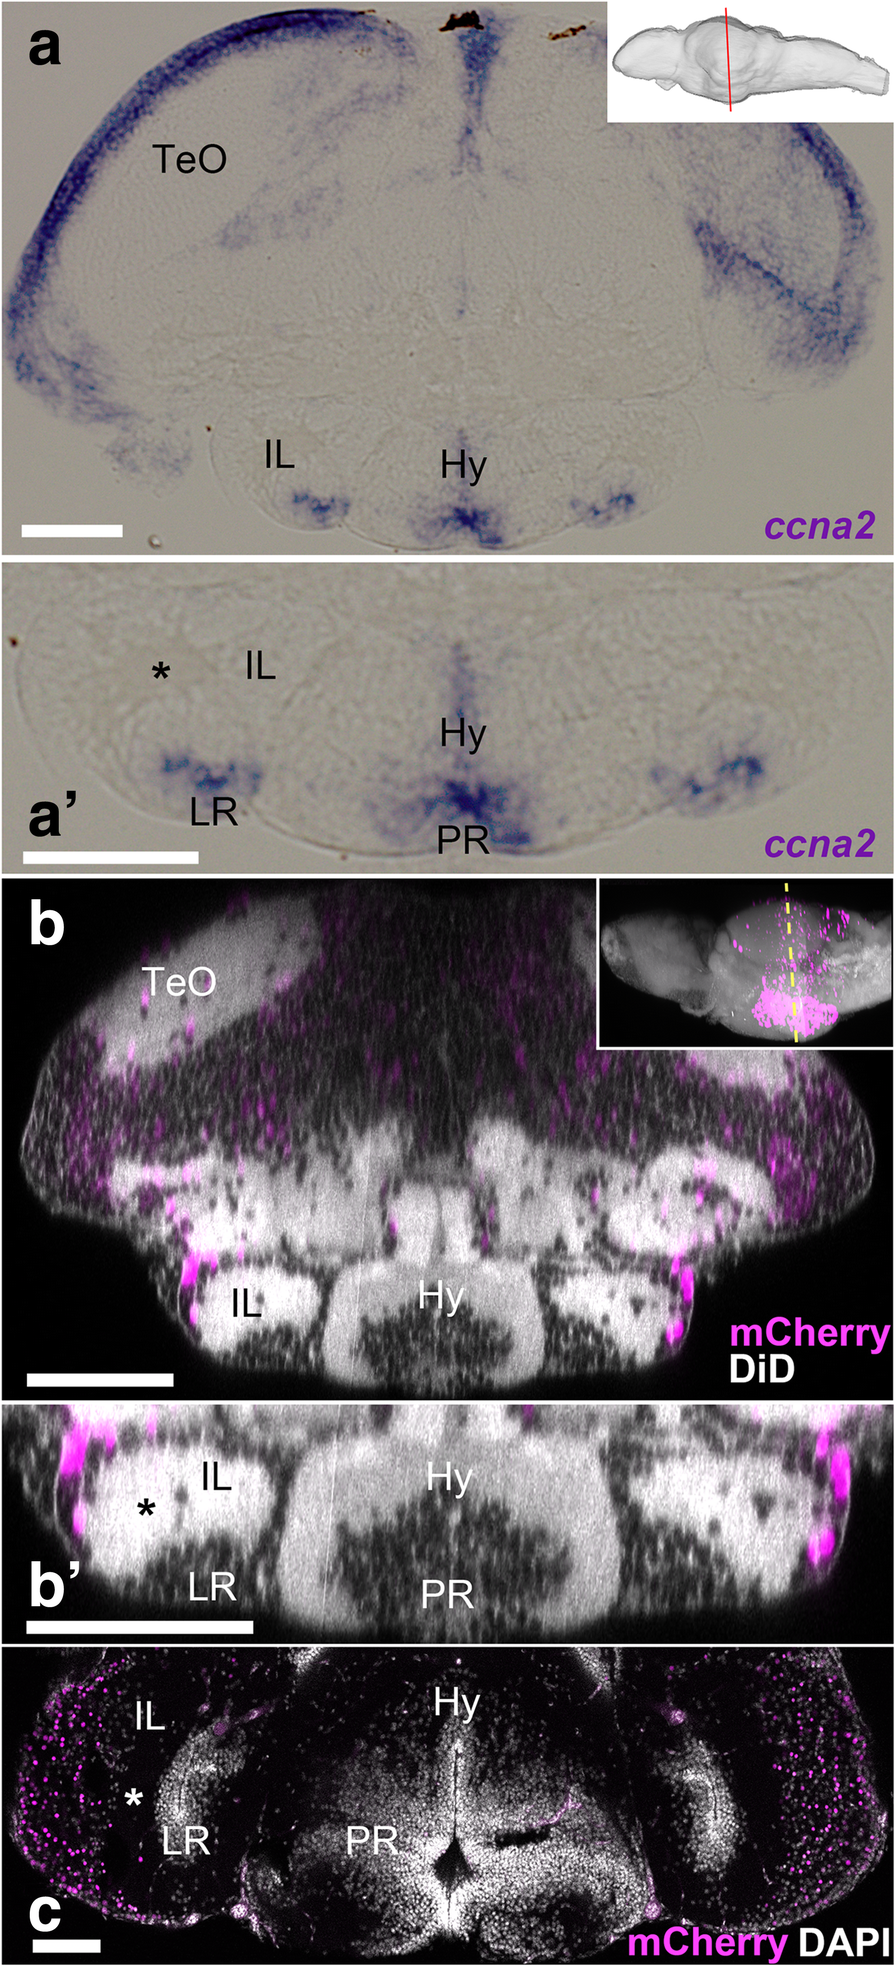
Fig. 7
Comparison of juvenile and adult IL in zebrafish. a, a’ Frontal section of the 14 dpf brain showing the transcripts of ccna2. The plane of the section is indicated in sagittal view in the right upper corner. a’ A higher magnification of the ventral part of a containing IL. The expression of ccna2 is found around LR. b, c Brains of Tg(her5:ERT2CreERT2;βact:lox-stop-lox-hmgb1:mCherry) zebrafish treated with tamoxifen at 24 hpf. b, b’ Frontal view of the 14 dpf brain which was obtained from 3D reconstruction of confocal images, showing mCherry-positive cells in magenta and DiD fiber labeling in gray. The plane of the section is indicated in sagittal view in the right upper corner. b’ A higher magnification of the ventral part of b containing IL. c Frontal section of the adult IL showing mCherry-positive cells in magenta and DAPI nuclear labeling in gray. Note that the gray represents DiD fiber labeling in b and b’, while it corresponds to DAPI nuclear labeling in c. The asterisks indicate the cell-free fiber zone that separates the mCherry-positive external zone and the ventricular zone (around LR). The mCherry-positive cells are much abundant in the adult IL than in the larval IL. Scale bar, 90 μm. Abbreviations: Hy hypothalamus, IL inferior lobe, LR lateral recess, PR posterior recess, TeO optic tectum