
- Title
-
Leptin induces muscle wasting in kras-driven hepatocellular carcinoma (HCC) model in zebrafish
- Authors
- Yang, Q., Yan, C., Wang, X., Gong, Z.
- Source
- Full text @ Dis. Model. Mech.
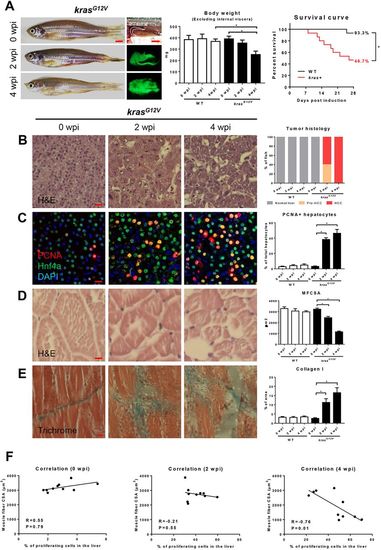
Characterization of zebrafish muscle wasting in krasG12V-induced HCC zebrafish.4-month-old male adult krasG12V and WT zebrafish were treated with dox for 4 weeks and sampled at 0 wpi, 2 wpi and 4 wpi. In each group, 15 fish were used to initiate the experiments. (A) Gross appearance and liver morphology (left), body weight excluding internal viscera (middle) and survival curves (right). (B) H&E staining of liver sections of krasG12V fish. Quantification of tumor histology (right). (C) IF staining of PCNA (red), Hnf4a (green) and DAPI (blue) in liver sections of krasG12V fish. Quantification of percentage of proliferating hepatocytes (right). (D) H&E staining of muscle sections of krasG12V fish. Quantification of MFCSA (right). (E) Gomori's trichrome staining of muscle sections of krasG12V fish. Quantification of percentage of collagen deposited area (right). (F) Correlation between percentage of proliferating cells in the liver (x-axis) and MFCSA (y-axis) at 0 wpi (left), 2 wpi (middle) and 4 wpi (right). *P<0.05. Scale bars: 2.5 mm in A; 10 μm in B-E. |
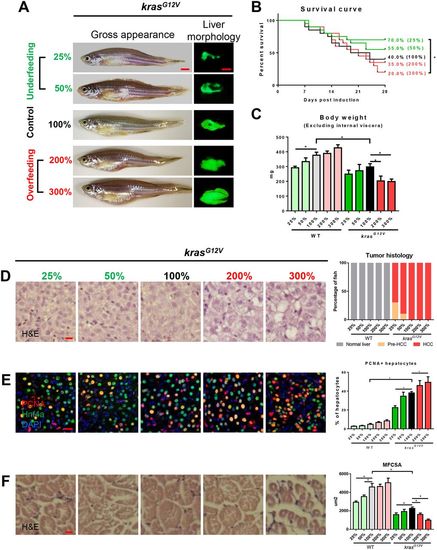
Effects of manipulation of food supplementation on hepatocarcinogensis and muscle wasting. 4-month-old male adult krasG12V and WT zebrafish were treated with dox for 4 weeks and fed with different levels of artemia. A total of 5 mg artemia cysts/fish/day for normal feeding was given, defined as 100%. There were two underfeeding groups with 25% and 50% the amount of food of normal feeding, and two overfeeding groups with 200% and 300% the amount of normal feeding. In each feeding group, 20 fish were used to initiate the experiments. (A) Gross appearance and liver morphology based on liver-specific GFP expression in krasG12V fish. (B) Survival curves. (C) Body weight excluding internal viscera. (D) H&E staining of liver sections of krasG12V fish (left) and quantification (right). (E) IF staining of PCNA (red), Hnf4a (green) and DAPI (blue) in liver sections. Quantification of percentage of proliferating hepatocytes (right). (F) H&E staining of muscle sections of krasG12V fish. Quantification of MFCSA of krasG12V fish (right). *P<0.05. Scale bars: 2.5 mm in A; 10 μm in D-F. PHENOTYPE:
|
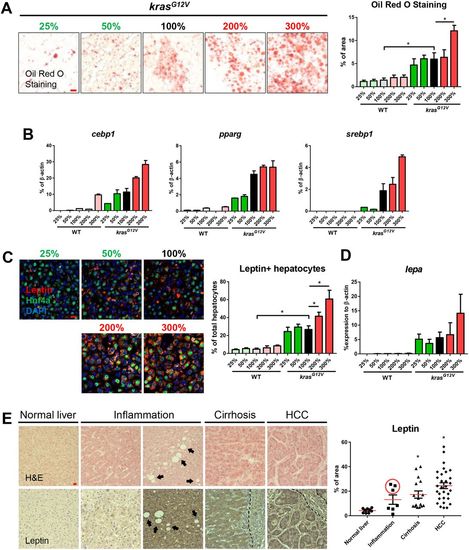
Fatty-liver-associated upregulation of leptin in zebrafish after krasG12V induction and in human liver disease patients. 4-month-old male adult krasG12V and WT zebrafish were treated with dox for 4 weeks and fed with different levels of artemia. (A) Oil Red O stain of liver sections of krasG12V fish (left) and quantification of percentage area with accumulated fat (right). (B) Expression of lipogenic genes (cebp1, pparg and srebp1) in livers of krasG12V and WT fish. (C) IF staining of leptin (red), Hnf4a (green) and DAPI (blue). Quantification of percentage of leptin-expressing hepatocytes (right). (D) Expression of lepa in livers of krasG12V and WT fish. (E) H&E staining (top row) and leptin expression (bottom row) of human liver disease samples. Patient samples were characterized into normal liver, inflammation, cirrhosis and HCC. Both low (left) and high (right) inflammation samples are shown and arrows indicate the presence of possible lipid droplets. The dashed line delimits the boundary of blood vessel. Quantification of leptin expression level in patient samples (right). The three high-leptin-expressing samples are circled in the inflammation group. *P<0.05. Scale bars: 10 μm. |
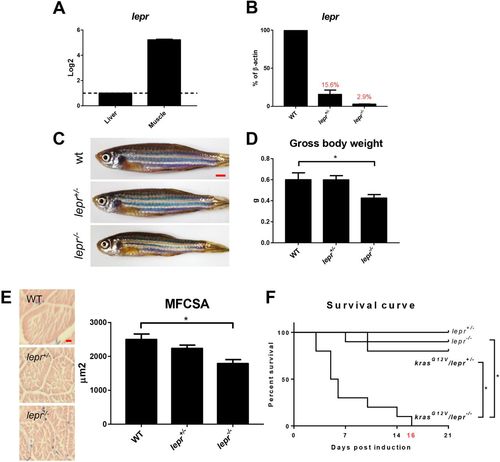
Expression of lepr and characterization of lepr mutant zebrafish. (A) RT-qPCR analyses of relative lepr mRNA expression in the liver and skeletal muscle in WT fish. The value of liver expression is arbitrarily set as 1. (B) RT-qPCR analyses of lepr mRNA expression in skeletal muscles in WT, lepr+/− and lepr−/− mutant zebrafish. Relative expression levels were the values with WT muscles set as 1. (C) Gross appearance of 4-month-old WT, heterogeneous and homogenous lepr mutant zebrafish. (D) Gross body weight. (E) H&E staining of muscle sections and quantification of MFCSA. (F) Survival curves after krasG12V induction in heterogeneous mutant fish, homogenous mutant fish and non-krasG12V controls. In each group, 10 fish were used to initiate the experiments. *P<0.05. Scale bars: 2.5 mm in C; 10 μm in E. |
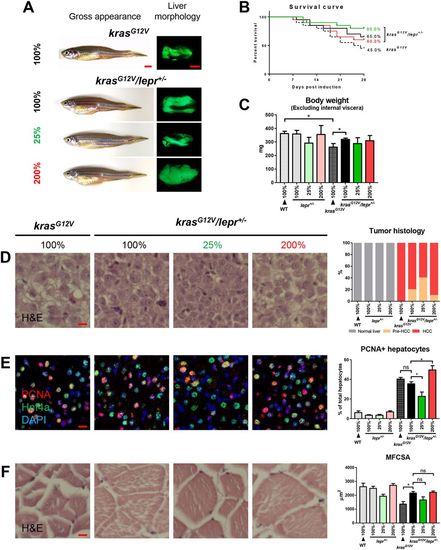
krasG12V induction in lepr heterogeneous mutant fish under different levels of feeding. lepr+/− fish with and without krasG12V were fed with 25%, 100% and 200% of artemia. Non-mutant WT and krasG12V fish were fed with 100% of artemia as controls for 4 weeks. In each feeding group, 20 fish were used to initiate the experiments. (A) Gross appearance and liver morphology based on liver-specific GFP expression in krasG12V fish. (B) Survival curves. (C) Body weight excluding internal viscera. (D) H&E staining of liver sections (left) and quantification (right). (E) IF staining of PCNA (red), Hnf4a (green) and DAPI (blue). Quantification of percentages of proliferating hepatocytes is presented on the right. (F) H&E staining of muscle sections (left) and quantification of MFCSA (right). *P<0.05. Scale bars: 2.5 mm in A; 10 μm in D-F. PHENOTYPE:
|
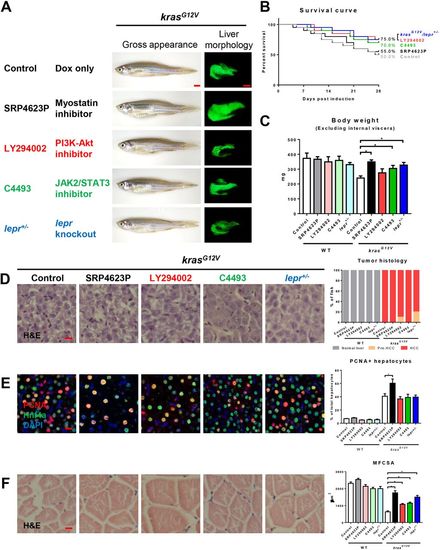
Effects on hepatocarcinogenesis and muscle wasting of chemical inhibitors targeting downstream of leptin in the signaling pathway. 4-month-old adult male krasG12V zebrafish were treated with dox for 4 weeks with or without SRP4623, LY294002 or C4493 treatment, in comparison with similarly dox-induced krasG12V/lepr+/− fish. In each group, 20 fish were used to initiate the experiments. (A) Gross appearance and liver morphology (left lateral view). Information of targets of chemical inhibitors is shown. (B) Survival curves. (C) Body weight excluding internal viscera. (D) H&E staining of liver sections (left) and quantification of tumor histology (right). (E) IF staining of PCNA (red), Hnf4a (green) and DAPI (blue). Quantification of percentage of proliferating hepatocytes is presented on the right. (F) H&E staining of muscle sections. Quantification of MFCSA is shown on the right. *P<0.05. Scale bars: 2.5 mm in A; 10 μm in D-F. PHENOTYPE:
|