
Fig. 3
|
Fig. 3
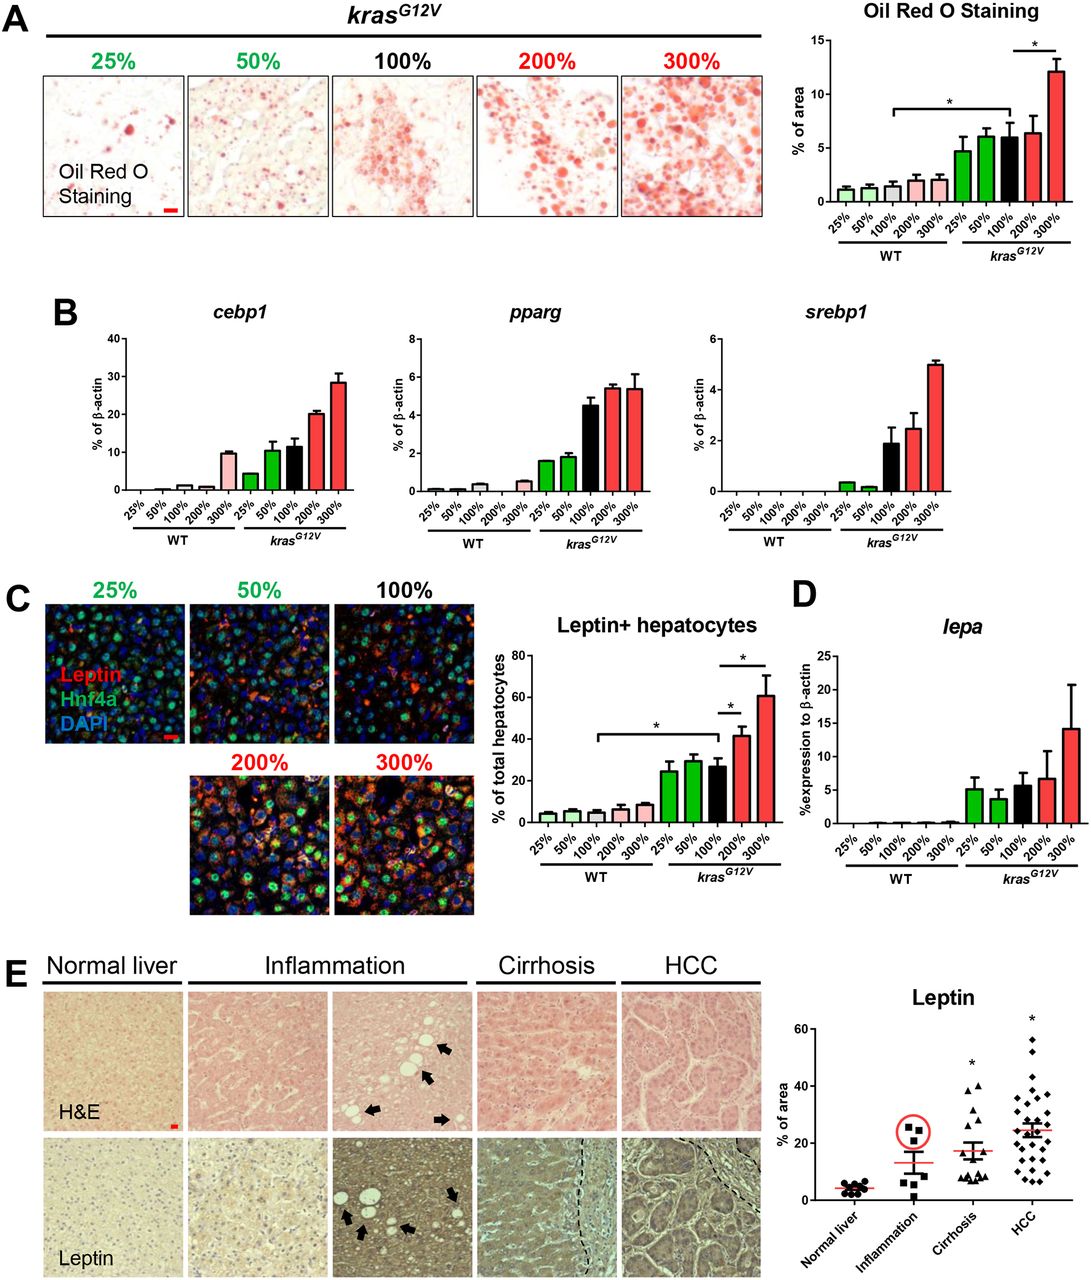
Fatty-liver-associated upregulation of leptin in zebrafish after krasG12V induction and in human liver disease patients. 4-month-old male adult krasG12V and WT zebrafish were treated with dox for 4 weeks and fed with different levels of artemia. (A) Oil Red O stain of liver sections of krasG12V fish (left) and quantification of percentage area with accumulated fat (right). (B) Expression of lipogenic genes (cebp1, pparg and srebp1) in livers of krasG12V and WT fish. (C) IF staining of leptin (red), Hnf4a (green) and DAPI (blue). Quantification of percentage of leptin-expressing hepatocytes (right). (D) Expression of lepa in livers of krasG12V and WT fish. (E) H&E staining (top row) and leptin expression (bottom row) of human liver disease samples. Patient samples were characterized into normal liver, inflammation, cirrhosis and HCC. Both low (left) and high (right) inflammation samples are shown and arrows indicate the presence of possible lipid droplets. The dashed line delimits the boundary of blood vessel. Quantification of leptin expression level in patient samples (right). The three high-leptin-expressing samples are circled in the inflammation group. *P<0.05. Scale bars: 10 μm.