
- Title
-
Mosaic Labeling and 3-Dimensional Morphological Analysis of Single Cells in the Zebrafish Left-right Organizer
- Authors
- Dasgupta, A., Jacob, A.E., Amack, J.D.
- Source
- Full text @ Bio Protoc
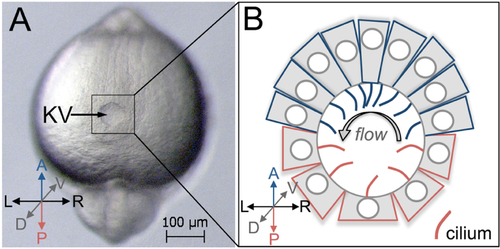
Kupffer’s vesicle in the zebrafish embryo. A. A dorsal view of Kupffer’s vesicle (KV) in a live zebrafish embryo at 8-somite stage (8 ss) of development. This is a brightfield image taken using a Zeiss Discovery V12 stereomicroscope. B. A schematic diagram of KV shows cell shapes at middle focal plane, and cilia (red and blue) projecting into the lumen to drive fluid flow within the KV after remodeling at 8 ss. A = Anterior; P = Posterior, L = Left; R = Right; D = Dorsal; V = Ventral. Anterior KV cells are represented in blue and posterior KV cells are red. Arrow = strong leftward flow. |
Two transgenic zebrafish strains– |
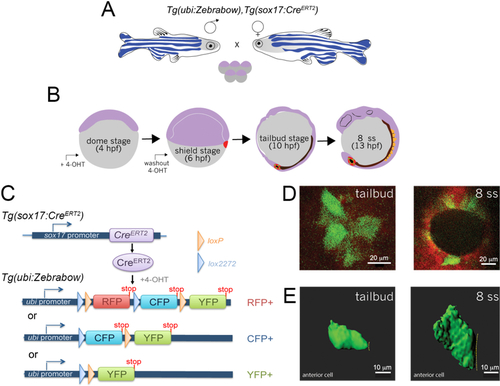
A. Double transgenic |
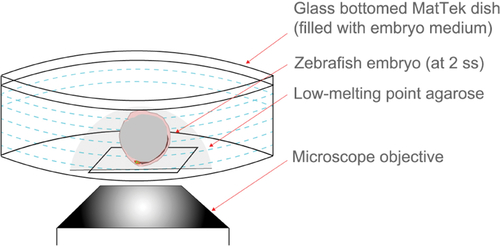
Schematic representing embryo immobilization technique used for live imaging with an inverted confocal microscope. A live embryo is covered with liquid low-melting point (LMP) agarose in a MatTek dish and then positioned such that DFC/KV cells are close to the glass bottom. Once solidified, the agarose is covered by embryo medium. |
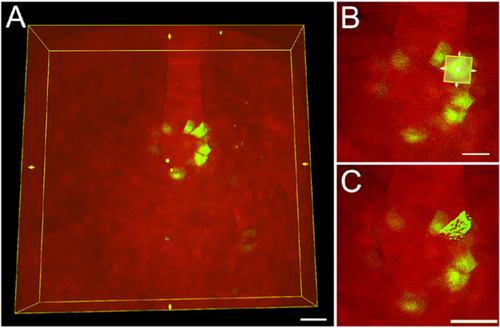
A. A region of interest (ROI) bounding box (yellow box) around an entire 3D image of mosaic-labeled KV cells. Scale bar = 30 μm. B. The ROI bounding box can be re-sized to include only a single cell. Scale bar = 20 μm. C. The software 3D renders only the cell included in the ROI. Scale bar = 30 μm. |
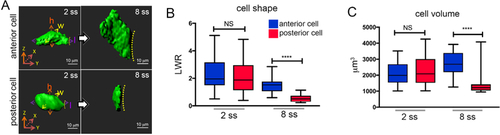
A. 3D renderings of cells in the anterior or posterior region of KV at the 2 somite stage (2 ss) or 8 somite stage (8 ss). Cell height (h), length (l), and width (w) measurements are shown at 2 ss. Dashed line indicates KV lumen surface. Scale bars = 10 μm. B-C. Box and whisker plots showing quantification of length to width ratio (LWR) that describes the shape of KV anterior or posterior cells (B), and quantification of cell volumes (C). n = 27 anterior cells at 2 ss; n = 25 posterior cells at 2 ss; n = 21 anterior cells at 8 ss; n = 22 posterior cells at 8 ss. Anterior and posterior KV cells have similar shapes and volumes at 2 ss, and then undergo asymmetric morphological changes that result in different cell shapes and volumes at 8 ss. n = number of cells analyzed. NS = not significant; **** |