FIGURE

Figure 2.

ID
ZDB-FIG-190723-1215
Publication
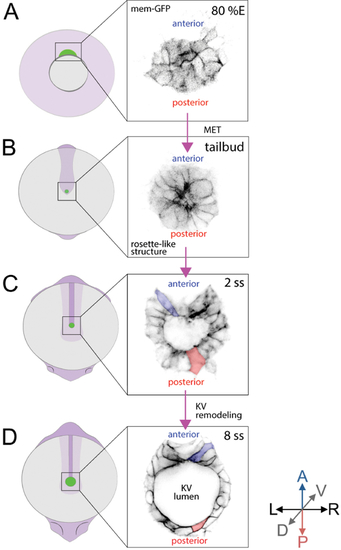
Dasgupta et al., 2018 - Mosaic Labeling and 3-Dimensional Morphological Analysis of Single Cells in the Zebrafish Left-right Organizer
Other Figures
All Figure Page
Back to All Figure Page
Figure 2.

Behavior and 2D morphology of DFC and KV cells during development.

Two transgenic zebrafish strains–Tg(dusp6:memGFP) and Tg(sox17:GFP-CAAX)–provide bright labeling of dorsal forerunner cells (DFCs) that give rise to Kupffer’s vesicle (KV) cells. A and B. Embryo diagrams (green represents DFC/KV cells) and inversed fluorescence images of membrane-localized GFP expression in DFCs in Tg(dusp6:memGFP) transgenic zebrafish at 80% epiboly stage (80% E) (A) and the tailbud stage (B) when migratory DFCs form a rosette structure. C and D. GFP expression in Tg(sox17:GFP-CAAX) transgenic zebrafish marks KV cell membranes during KV lumen formation at the 2 somite stage (2 ss) (C) and in the mature organ at 8 ss (D) after KV remodeling. A = Anterior; P = Posterior, L = Left; R = Right; D = Dorsal; V = Ventral. Anterior cells = blue, Posterior cells = red.

Expression Data

Expression Detail
Antibody Labeling
Phenotype Data

Phenotype Detail
Acknowledgments
This image is the copyrighted work of the attributed author or publisher, and ZFIN has permission only to display this image to its users. Additional permissions should be obtained from the applicable author or publisher of the image. Full text @ Bio Protoc