
|
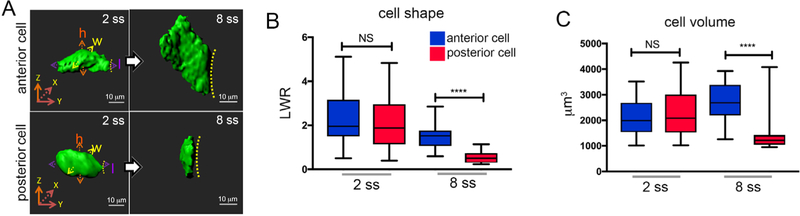
Figure 6.
A. 3D renderings of cells in the anterior or posterior region of KV at the 2 somite stage (2 ss) or 8 somite stage (8 ss). Cell height (h), length (l), and width (w) measurements are shown at 2 ss. Dashed line indicates KV lumen surface. Scale bars = 10 μm. B-C. Box and whisker plots showing quantification of length to width ratio (LWR) that describes the shape of KV anterior or posterior cells (B), and quantification of cell volumes (C). n = 27 anterior cells at 2 ss; n = 25 posterior cells at 2 ss; n = 21 anterior cells at 8 ss; n = 22 posterior cells at 8 ss. Anterior and posterior KV cells have similar shapes and volumes at 2 ss, and then undergo asymmetric morphological changes that result in different cell shapes and volumes at 8 ss. n = number of cells analyzed. NS = not significant; ****