
- Title
-
pouC regulates expression of bmp4 during atrioventricular canal formation in zebrafish
- Authors
- Bhakta, M., Padanad, M.S., Harris, J.P., Lubczyk, C., Amatruda, J.F., Munshi, N.V.
- Source
- Full text @ Dev. Dyn.
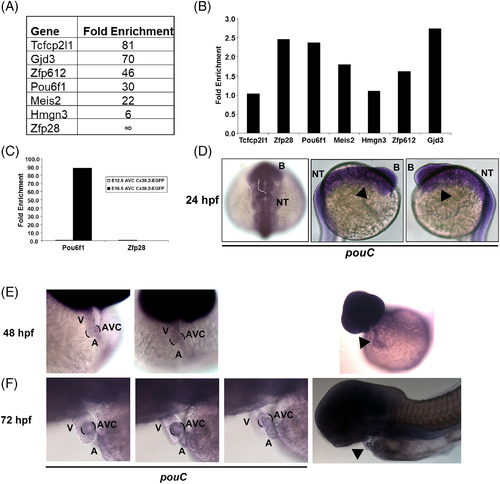
Mouse Pou61 and zebrafish pouC are expressed in the AVC. A: Cx30.2‐lacZ+ mouse AVC cells were isolated at E12.5 by flow cytometry and subsequently profiled by microarray analysis (Harris et al., 2014). The top six transcription factors based on fold enrichment in Cx30.2‐lacZ+vs. Cx30.2‐lacZ‐ AVC cells are shown along with Gjd3/Cx30.2 for comparison. B: The AVC of E10.5 hearts were micro‐dissected and used to generate cDNA for qRT‐PCR analysis with the indicated primers. Fold enrichment is shown relative to E10.5 whole heart and normalized to Gapdh. C: E12.5 and E16.5 AVC tissue was micro‐dissected from Cx30.2‐EGFP transgenic mice, and GFP+ and GFP‐ cells were isolated by flow cytometry. RNA from each cell population was used to created cDNA for qRT‐PCR analysis with the indicated primers. Fold enrichment refers to GFP+ vs. GFP‐ populations and normalized to Gapdh. D: In situ hybridization of a 24 hpf embryo using a pouC riboprobe. Dashed white outline demonstrates expected location of the heart at this developmental stage. Black arrowhead indicates location of the heart. E,F: In situ hybridization with a pouC probe was performed in zebrafish at 48 (E) and 72 (F) hpf. Wide angle images are shown at right for perspective. Black brackets indicated AVC region, while black arrowhead highlights pouC expression in the heart. B, brain; NT, neural tube; V, ventricle; A, atrium. EXPRESSION / LABELING:
|
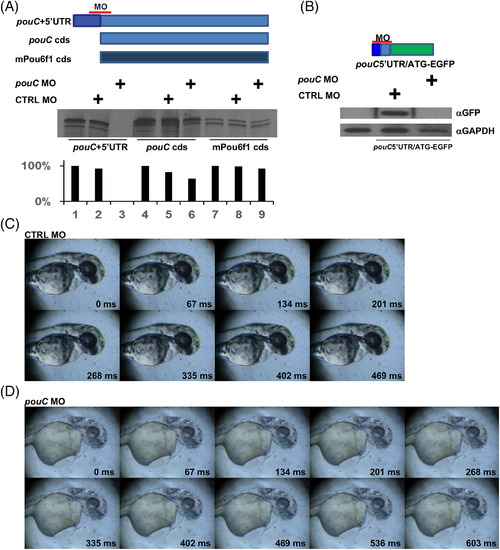
pouC knockdown perturbs cardiac function. A: in vitro transcription‐translation assay using reticulocyte lysate. Each of the indicated mRNA templates was incubated with no MO, control (CTRL) MO, or a pouC MO that binds to a region that overlaps the start codon. 35S‐labeled protein was resolved by sodium dodecyl sulfate‐polyacrylamide gel electrophoresis and exposed to film. Band quantitation (bottom) is depicted as a percentage intensity compared with untreated mRNA template. B: Zebrafish embryos were injected with the indicated pouC 5′UTR‐EGFP fusion mRNA alone or with CTRL MO or pouC MO. Embryo extracts were probed with the indicated antibodies by Western blotting. C: Video was captured at 78 hpf for a zebrafish embryo injected with control (CTRL) MO at the one‐cell stage. One cardiac cycle is shown with the indicated time stamp for each captured video frame. D: Same as in (C) for a 78 hpf zebrafish embryo injected with pouC MO. A slowed heart rate is indicated by the length of the cardiac cycle compared with the control embryo. Inefficient contraction, pooling of blood, and pericardial edema are also evident in the video frames. PHENOTYPE:
|
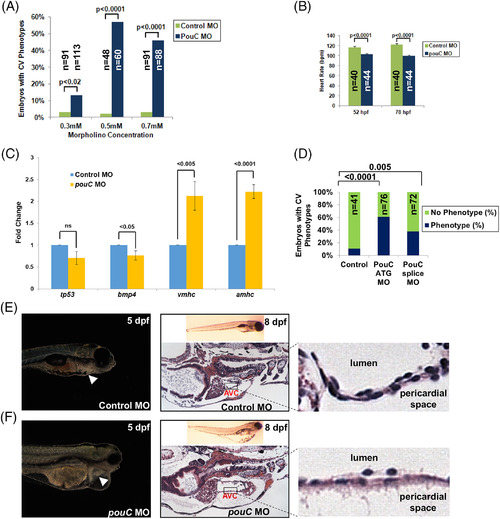
pouC knockdown impairs cardiac morphogenesis. A: Zebrafish embryos were injected with the indicated concentration of control or pouC MO and scored for a cardiovascular phenotype, which included pericardial edema, sluggish heart rate, abnormal looping, or impaired contraction. B: Heart rate was measured in control and pouC morphant zebrafish at 52 and 78 hpf. C: Zebrafish embryos were injected with control or pouC ATG MO. Total embryo RNA was isolated, and cDNA was prepared for qRT‐PCR analysis using the indicated primer sets. D: Zebrafish embryos were injected with control, pouC ATG, or pouC splicing MO. Cardiovascular phenotypes were assessed at 48 hpf. E: The left image shows a control zebrafish at 5 dpf with the heart indicated by a white arrowhead. The right image demonstrates a control zebrafish at 8 dpf in whole‐mount (top) and a section through the AVC with a zoomed view shown at right. F: Same as in (E) for a pouC morphant zebrafish. Note the decreased cellularity of the AVC region in pouC morphant embryos. |
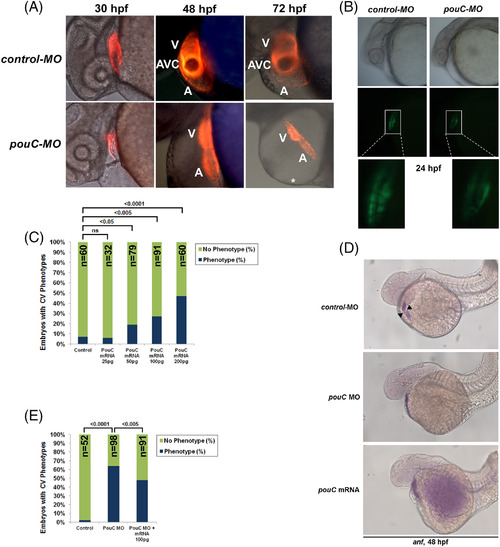
Precise levels of pouC are required for normal AVC formation. A: Tg(cmlc2:mCherry) zebrafish were injected with control or pouC MO and imaged by fluorescence microscopy at the indicated hpf. A, atrium; V, ventricle; *, pericardial edema. B: Tg(cmlc2‐EGFP) zebrafish embryos were injected with control or pouC MO and imaged by brightfield (top) and fluorescence (bottom) illumination at 24 hpf. Zoomed inset is shown below for both images. C: Titration of injected pouC mRNA into zebrafish showed a dose‐dependent increase in observed cardiovascular phenotypes. D: Zebrafish embryos were injected with control or pouC MO or pouC mRNA, and anf expression was visualized by in situ hybridization. While control embryos showed anf exclusion from the AVC region (black arrowheads), both pouCknockdown and overexpression led to similar anf expression throughout the linear heart tube. E: Zebrafish were injected with control MO, pouC MO, or pouC MO plus 100 pg of pouC mRNA. A, atrium; V, ventricle. EXPRESSION / LABELING:
|
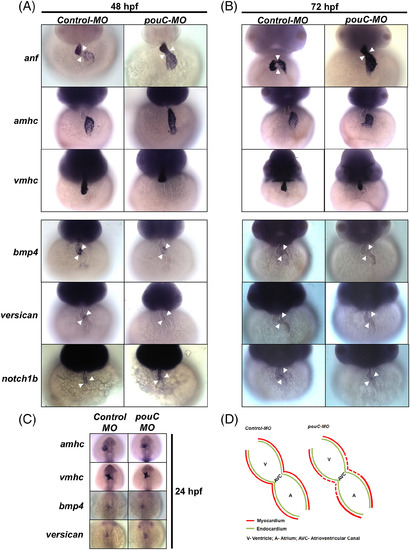
pouC regulates myocardial specification in the AVC. A: Representative in situ hybridization analysis performed on control and pouC morphant zebrafish at 48 hpf. B: Same as in (A) at 72 hpf. C: Zebrafish embryos were injected with control or pouC MO, and in situ hybridization analysis was performed at 24 hpf using the indicated probes. D: Schematic summary of marker analysis, demonstrating a specific defect in AVC cardiomyocyte specification in pouCmorphant embryos. anf, atrial natriuretic factor; amhc, atrial myosin heavy chain; vmhc, ventricular myosin heavy chain. Cardiac borders outlined with dotted lines, and arrowheads indicate region of AVC. EXPRESSION / LABELING:
PHENOTYPE:
|