
- Title
-
Resting cells rely on the DNA helicase component MCM2 to build cilia
- Authors
- Casar Tena, T., Maerz, L.D., Szafranski, K., Groth, M., Blätte, T.J., Donow, C., Matysik, S., Walther, P., Jeggo, P.A., Burkhalter, M.D., Philipp, M.
- Source
- Full text @ Nucleic Acids Res.
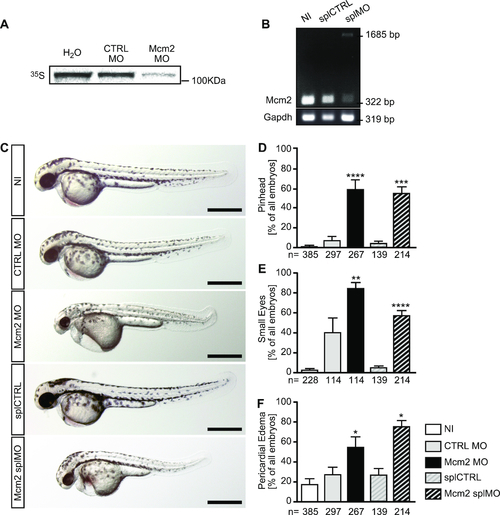
Morphological analysis of zebrafish lacking Mcm2. (A) Autoradiogram to show the binding efficiency of the Mcm2 MO. In vitrotranslation of Mcm2 was done in the presence of CTRL (CTRL MO) and translation blocking MO (Mcm2 MO) using a cell-free reticulocyte lysate and 35S-labeled methionine. As template, pCS2+ containing parts of the 5′-UTR fused to the ORF of Mcm2 was used. n = 3 MO binding tests (in triplicate). (B) RT-PCR of non-injected (NI), control injected (splCTRL) and splice blocking injected (splMO) embryos at 24 hpf. In embryos with Mcm2 splMO the original band at 322 bp partially disappeared. Instead a second band at 1685 bp could be detected, which contained parts of intron 2. n = 2 independent experiments. (C) Live images of zebrafish at 48 hpf. Scale bars: 500 μm. (D) Mcm2 depleted embryos develop smaller anterior structures. Numbers of embryos analysed are given below the bars. 3–10 independent experiments. **** indicates a P value ≤0.0001, *** means P≤ 0.001. One-way ANOVA with Sidak's multiple comparison test. (E) Loss of Mcm2 impairs eye development. Numbers of embryos analysed are given below the bars. 3–6 independent experiments. **** indicates a P value ≤0.0001, ** means P ≤ 0.01. One-way ANOVA with Sidak's multiple comparison test. (F) Zebrafish lacking Mcm2 show a tendency to develop pericardial edema. Numbers of embryos analysed are given below the bars. 3–11 independent experiments. * indicates a Pvalue <0.05. One-way ANOVA with Sidak's multiple comparison test.
|
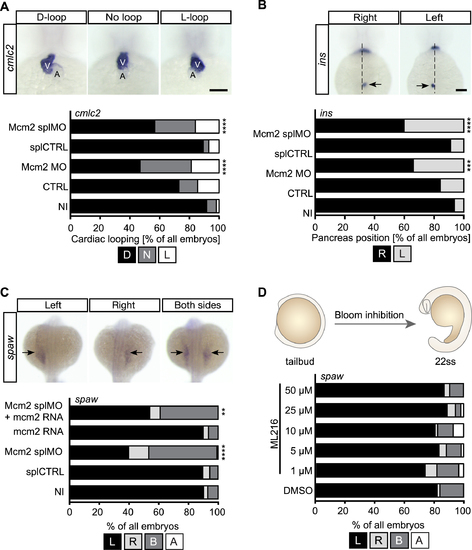
Loss of Mcm2 disrupts left-right asymmetry development. (A) Heart looping is randomized upon Mcm2 knockdown. Upper panel shows representative images of correct (D-loop) and aberrant heart looping (no loop, L-loop) at 48 hpf after in situ hybridization (ISH) for cmlc2. A, atrium; V, ventricle. Scale bar: 100 μm. Stacked bar graph summarizes heart looping experiments. D, D-loop; N, no loop; L, L-loop. P = 0.0003 (CTRL vs Mcm2 MO), P < 0.0001 (splCTRL vs Mcm2 splMO). n = 5–10 experiments. Number of embryos: NI = 309; CTRL = 166; Mcm2 MO = 128; splCTRL = 113; Mcm2 splMO = 194. (B) Example images of insulin (ins) ISH labelling of the endocrine pancreas (arrows). R, right (correct) or L, left (wrong position) of the embryonic midline. Scale bar: 100 μm.Graph displays quantification of aberrant pancreas position upon Mcm2 knockdown. P = 0.0052 (CTRL vs Mcm2 MO), P < 0.0001 (splCTRL vs Mcm2 splMO). n = 4–9 experiments. Number of embryos: NI = 299; CTRL = 146; Mcm2 MO = 109; splCTRL = 113; Mcm2 splMO = 192. (C) Loss of Mcm2 results in ambiguous southpaw (spaw) expression at 22 ss, which can be partially rescued by co-injection of mcm2 RNA. Upper panel shows examples of correct and aberrant spaw distribution. P < 0.0001 (splCTRL vs Mcm2 splMO), P = 0.0029 (splMO vs Mcm2 splMO + mcm2 RNA). n = 3 experiments. Number of embryos: NI = 156; splCTRL = 166; Mcm2 splMO = 152, mcm2 RNA = 142; Mcm2 splMO + mcm2 RNA = 181. (D) ML216-mediated inhibition of Bloom and Werner helicases from tailbud stage until 22ss does not affect asymmetry development. n = 3 experiments. Number of embryos: DMSO = 56; 1 μM ML216 = 61; 5 μM ML216 = 60; 10 μM ML216 = 57; 25 μM ML216 = 54; 50 μM ML216 = 53. All data analysed using two-tailed Fisher's exact test. EXPRESSION / LABELING:
PHENOTYPE:
|
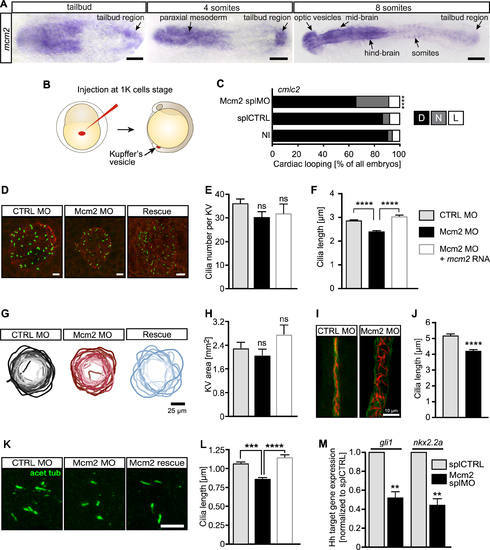
Impaired left-right asymmetry development upon Mcm2 knockdown is accompanied by shorter cilia. (A) Expression of mcm2in the tailbud of zebrafish embryos. Scale bars: 150 μm (tailbud and 4ss), 200 μm (8 ss). (B) Injection strategy to target KV cells. (C) Randomized heart looping after KV-specific Mcm2 ablation. P = 0.0007, two-tailed Fisher's exact test. n = 4 experiments. Number of embryos: NI = 121; splCTRL = 115; Mcm2 splMO = 118. (D) Confocal stacks of motile cilia (green) in the KV of 6–8 ss embryos injected with Mcm2 control or Mcm2 translation blocking MO. Cilia were labelled using an anti-acetylated tubulin antibody. Apical cell borders for visualization of the KV area were stained with an anti-PKCζ antibody (red). Scale bar: 10 μm. (E) Cilia numbers are not changed in the KV of Mcm2 morphants. P = 0.1403 (CTRL MO vs Mcm2 MO), p>0.9999 (Mcm2 MO/Ctrl Mo vs Rescue). Kruskal–Wallis test with Dunn's multiple comparisons test. In four experiments 29 CTRL MO, 28 Mcm2 MO and 12 Rescue KVs were assessed. (F) Depletion of Mcm2 results in shorter KV cilia, which can be rescued by co-injection of MO-insensitive RNA encoding Mcm2. P < 0.0001. Kruskal–Wallis test with Dunn's multiple comparisons test. n = 4 with 920 CTRL MO and 870 Mcm2 MO and 243 Rescue cilia. (G) KV outlines at 6–8 ss. Darker colour reflects larger areas. Scale bar: 25 μm. (H) KV is not significantly altered upon Mcm2 knockdown or its rescue. n = 19 CTRL MO, 22 Mcm2 MO and 10 Rescue KVs. P = 0.7952 (Ctrl MO vs Mcm2 MO), P = 0.1425 (Mcm2 MO vs Rescue). Kruskal–Wallis test with Dunn's multiple comparisons test. (I) Confocal stacks of immunostained pronephric ducts (cilia: acetylated tubulin, red, duct: PKCζ, green) at 24 hpf. Dilatation of the pronephric duct as well as disorganization of cilia was seen in the majority of Mcm2 depleted zebrafish. Scale bar: 10 μm. (J) Distal cilia length in the pronephros is reduced upon Mcm2 knockdown. n = 10 CTRL MO and 8 Mcm2 MO embryos with 368 and 299 cilia, respectively. P < 0.0001. Two-tailed Mann–Whitney test. (K) Primary cilia in the tailbud of 6–8 ss embryos. Scale bar: 5 μm. (L) Primary cilia length is reduced in the presence of Mcm2 MO and restored, when co-injected with RNA encoding Mcm2. n = 375 (CTRL MO), 413 (Mcm2 MO) and 171 (Mcm2 rescue) cilia. P < 0.0001. Kruskal–Wallis test with Dunn's multiple comparisons test. (M) Hh pathway activity is dampened in Mcm2 depleted zebrafish as shown for the Hh target genes gli1 and nkx2.2a. P = 0.0018 (gli1) and P = 0.0013 (nkx2.2a), unpaired, two-tailed t-test with Welch's correction. n = 5 experiments.
EXPRESSION / LABELING:
PHENOTYPE:
|
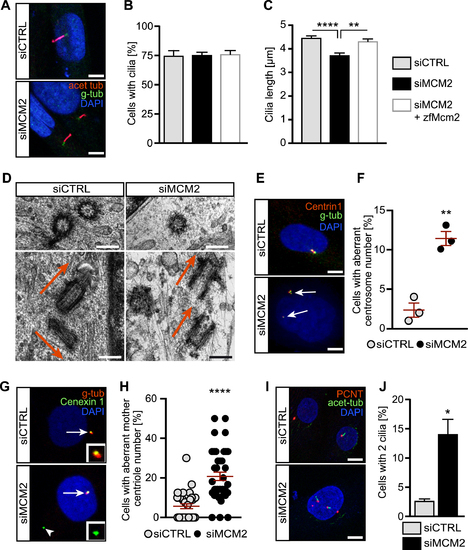
MCM2 controls the formation and function of primary cilia and prevents centrosome amplification. (A) Shorter cilia in hTert 1BR3 cells transfected with MCM2 siRNA using liposomes compared to cells transfected with control siRNAs. Scale bar: 5 μm. (B) Primary cilia form at similar rates upon nucleofection with CTRL siRNA, MCM2 siRNA or MCM2 siRNA plus a plasmid encoding zebrafish Mcm2. P >0.9999, Kruskal–Wallis test. n = 3 transfections. 100 cells were counted in each condition per transfection. (C) Primary cilia are shorter in the absence of MCM2. This can be rescued by zebrafish Mcm2 co-nucleofection. **P = 0.0069, ****P < 0.0001, Kruskal–Wallis test with Dunn's multiple comparisons test. n = 94 (siCTRL+empty vector), 92 (siMCM2+empty vector) and 93 cilia (siMCM2+zfMcm2) cilia from three nucleofections. (D) Cryo-EM pictures of centrosomes in control and MCM2 KD cells. Transverse section (upper row) shows a singlet centriole after MCM2 knockdown. Longitudinal sections (lower row) shows correct perpendicular orientation of the centrioles in control cells, while MCM2 knockdown cells show two mother centrioles in parallel to each other. Scale bar: 250 μm. (E) Centrin1 staining reveals supernumerary centrosomes after MCM2 knockdown. Scale bar: 10 μm. (F) Quantification of aberrant centrosome numbers in control and MCM2 siRNA transfected cycling cells. n = 3 three transfections. Per condition and transfection 100 cells were counted. P = 0.0019. Unpaired, two-tailed t-test with Welch's correction. (G) Additional centriolar material (arrowhead) in MCM2 depleted cells is Cenexin 1 positive, which indicates mother centrioles. Gamma-Tubulin was used to counterstain centrioles. Arrow: regular centrosome. Inset: higher magnification of Cenexin1+ material. (H) Percentage of cells with additional mother centrioles. P < 0.0001, unpaired, two-tailed Mann–Whitney test. Number of cells: siCTRL = 325 cells; siMCM2 = 314 cells (three experiments). (I) MCM2 depletion induces the formation of more than one primary cilium per cell. Immunofluorescence of cycling cells stained for PCNT and acetylated tubulin. Scale bar: 10 μm. (J) Percentage of ciliated cells with two cilia. P = 0.0111, unpaired, two-tailed t-test with Welch's correction. Number of cells: siCTRL = 625 cells; siMCM2 = 495 cells (n = 5).
|
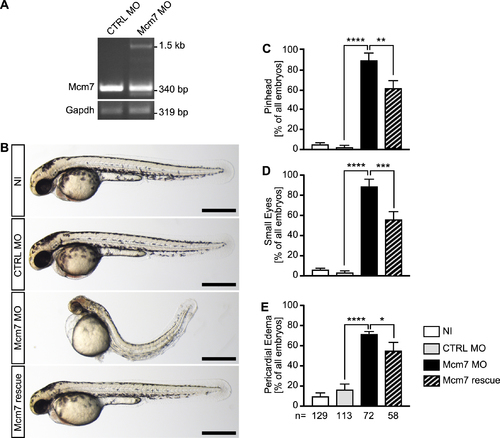
Mcm7 knockdown in zebrafish. (A) RT-PCR of control injected (CTRL MO) and Mcm7 MO injected embryos at 24 hpf. In embryos with Mcm7 MO the original band at 340 bp partially disappeared. Instead a second band around 1500 bp could be detected, which contained intronic sequences. n = 3 independent experiments. (B) Live images of zebrafish at 48 hpf. Scale bars: 500 μm. (C) Mcm7 depleted embryos develop smaller anterior structures, which is partially rescued by co-injection of RNA encoding human MCM7. Five independent experiments. **P < 0.01, ****P < 0.0001. One-way ANOVA with Holm–Sidak's multiple comparison test. (D) Loss of Mcm2 impairs eye development. Five independent experiments. ***P < 0.001, ****P < 0.0001. One-way ANOVA with Holm–Sidak's multiple comparison test. (E) Zebrafish lacking Mcm7 develop pericardial edema. 5 independent experiments. *P < 0.05, ***P < 0.0001. One-way ANOVA with Holm–Sidak's multiple comparison test. (C–E) Numbers of embryos analysed are given below the bars in E.
|
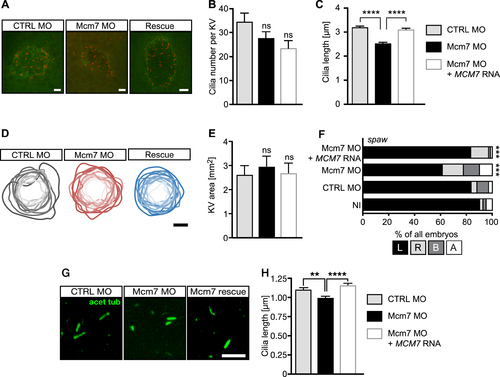
Loss of MCM7 impairs cilia in zebrafish. (A) Confocal stacks of zebrafish KVs at 8ss. Cilia in red (acetylated tubulin) and apical borders of KV in green (PKCζ). Scale bar: 5 μm. (B) Cilia number is not significantly changed upon loss of Mcm2, but shows a tendency towards fewer cilia. Rescue embryos were consecutively injected with Mcm7 MO and capped RNA for human MCM7, which is insensitive to the MO. N = 14 (CTRL MO), 18 (Mcm7 MO) and 16 (Mcm7 MO+MCM7 RNA) KVs. P = 0.4035 (CTRL MO vs Mcm7 MO), 0.7541 (Mcm7 MO vs Rescue) and 0.0873 (CTRL MO vs Mcm7 Rescue). One-way ANOVA with Sidak's multiple comparison test. (C) Mcm7 knockdown leads to shorter KV cilia. Co-injection of RNA for human MCM7 rescues cilium length. P < 0.0001. Kruskal–Wallis test with Dunn's multiple comparisons test. n = 482 CTRL MO, 480 Mcm2 MO and 355 Rescue cilia. (D) Manipulation of Mcm7 levels does not change the area of the KV. Cartoon displays outlines of individual KVs with darker shading indicating larger areas. Scale bar: 25 μm. (E) Bar graph summarizing KV area measurements in control conditions and upon Mcm7 knockdown and rescue thereof. N = 14 (CTRL MO), 11 (Mcm7 MO) and 11 (Mcm7 MO+MCM7 RNA) KVs. P = 0.9269 (CTRL MO vs Mcm7 MO or Rescue). One-way ANOVA with Holm–Sidak's multiple comparison test. (F) The laterality gene southpaw (spaw) loses its leftward restriction upon knockdown of Mcm7 (22 ss). Reconstitution with human MCM7 restores expression left from the midline. ***P < 0.001 (CTRL MO vs Mcm7 MO and Mcm7 MO vs Mcm7 MO+hMCM7), two-tailed Fisher's exact test. Number of embryos: NI = 81; CTRL MO = 67; Mcm7 MO = 80, Mcm7 MO+hMCM7 = 66. (G) Confocal z-stacks of primary cilia in the tailbud of 8 ss embryos. Scale bar: 5 μm. (H) Knockdown of Mcm7 reduces primary cilium length in vivo. Co-injection of RNA for human MCM7 rescues the defect. n = 382 (CTRL MO), 334 (Mcm7 MO) and 272 (Mcm7 rescue) cilia. **P=0.0046, ****P < 0.0001. Kruskal–Wallis test with Dunn's multiple comparisons test.
EXPRESSION / LABELING:
PHENOTYPE:
|