
Fig. 4
- ID
- ZDB-FIG-190524-4
- Publication
- Casar Tena et al., 2018 - Resting cells rely on the DNA helicase component MCM2 to build cilia
- Other Figures
- All Figure Page
- Back to All Figure Page
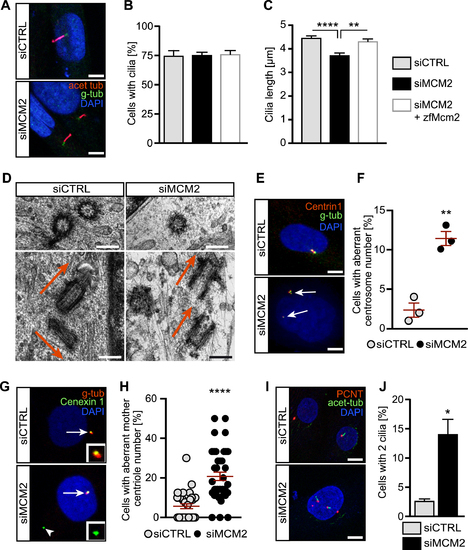
MCM2 controls the formation and function of primary cilia and prevents centrosome amplification. (A) Shorter cilia in hTert 1BR3 cells transfected with MCM2 siRNA using liposomes compared to cells transfected with control siRNAs. Scale bar: 5 μm. (B) Primary cilia form at similar rates upon nucleofection with CTRL siRNA, MCM2 siRNA or MCM2 siRNA plus a plasmid encoding zebrafish Mcm2. P >0.9999, Kruskal–Wallis test. n = 3 transfections. 100 cells were counted in each condition per transfection. (C) Primary cilia are shorter in the absence of MCM2. This can be rescued by zebrafish Mcm2 co-nucleofection. **P = 0.0069, ****P < 0.0001, Kruskal–Wallis test with Dunn's multiple comparisons test. n = 94 (siCTRL+empty vector), 92 (siMCM2+empty vector) and 93 cilia (siMCM2+zfMcm2) cilia from three nucleofections. (D) Cryo-EM pictures of centrosomes in control and MCM2 KD cells. Transverse section (upper row) shows a singlet centriole after MCM2 knockdown. Longitudinal sections (lower row) shows correct perpendicular orientation of the centrioles in control cells, while MCM2 knockdown cells show two mother centrioles in parallel to each other. Scale bar: 250 μm. (E) Centrin1 staining reveals supernumerary centrosomes after MCM2 knockdown. Scale bar: 10 μm. (F) Quantification of aberrant centrosome numbers in control and MCM2 siRNA transfected cycling cells. n = 3 three transfections. Per condition and transfection 100 cells were counted. P = 0.0019. Unpaired, two-tailed t-test with Welch's correction. (G) Additional centriolar material (arrowhead) in MCM2 depleted cells is Cenexin 1 positive, which indicates mother centrioles. Gamma-Tubulin was used to counterstain centrioles. Arrow: regular centrosome. Inset: higher magnification of Cenexin1+ material. (H) Percentage of cells with additional mother centrioles. P < 0.0001, unpaired, two-tailed Mann–Whitney test. Number of cells: siCTRL = 325 cells; siMCM2 = 314 cells (three experiments). (I) MCM2 depletion induces the formation of more than one primary cilium per cell. Immunofluorescence of cycling cells stained for PCNT and acetylated tubulin. Scale bar: 10 μm. (J) Percentage of ciliated cells with two cilia. P = 0.0111, unpaired, two-tailed t-test with Welch's correction. Number of cells: siCTRL = 625 cells; siMCM2 = 495 cells (n = 5).
|