
- Title
-
A Wilson cell origin for Kupffer's vesicle in the zebrafish
- Authors
- Warga, R.M., Kane, D.A.
- Source
- Full text @ Dev. Dyn.
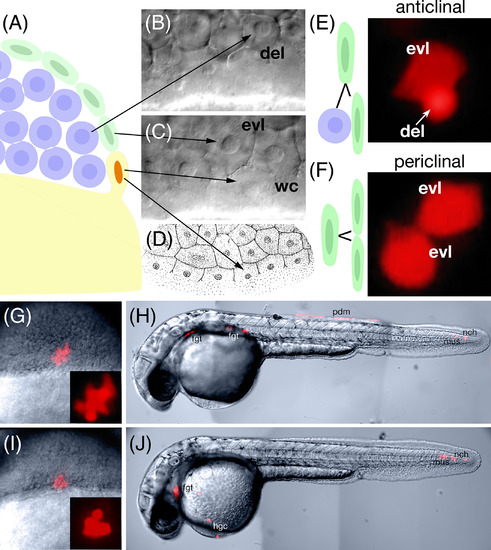
Enveloping layer clonal fates inconsistent with the zebrafish fate map. A: Schematic of the three domains of the blastoderm at the mid blastula transition (3 h): exterior enveloping layer cells (green), deep domain cells (blue), and Wilson cells (orange nuclei), which are cytoplasmically continuous with the yolk cell (yellow). B–D: Deep (B) and superfical (C) focal plane of the blastoderm showing the three cell types. Abbreviations: evl, enveloping layer; wc, Wilson cell; del, deep cell. (D) Figure 22 from plate 90 (Supplementary Figs. S1 and S2) of H. V. Wilson (1889) showing a surface view of the blastoderm edge. Marginal cells cytoplasmically continuous with the yolk, which we term Wilson cells in this study, will after one or two more divisions collapse into the yolk cell to become the yolk syncytial layer. E,F: Lineage relationships of enveloping layer cells before the 4K‐cell stage. Enveloping layer cells can divide (E) anticlinally to produce an evl‐del sibling pair or (F) periclinally to produce and evl‐evl sibling pair. The evl‐del sibling pair will go on to produce a subclone of enveloping layer cells and a subclone of deep cells whereas the evl‐evl sibling pair will go on to produce a clone exclusively of enveloping layer cells. Deep cells can be easily identified by their smaller apparent size, spherical shape and intense fluorescence compared with the larger, flatter and polygonal‐shaped enveloping layer cells whose fluorescence is more diffuse due their thinner dimension in face view. Fluorescent images to the right show examples from our documentation. G–J: Examples of dorsal marginal clones derived from anticlinal divisions of labeled enveloping layer cells. G,H: Example of a clone where (G) at shield stage (6 h) there was a subclone of enveloping layer cells (less intense polygonal cells) and a subclone of deep cells (very intense round cells). Later in the 30‐h embryo (H), there was posterior periderm (pdm) derived from the enveloping layer subclone as well as nearby tail mesoderm notochord (nch) and muscle (mus), not normally derived from dorsal marginal deep cells, but typical derivatives of dorsal forerunner cells. In the head there was also foregut endoderm (fgt) a typical derivative of dorsal marginal deep cells. I,J: Example of a clone where (I) at shield stage, the enveloping layer subclone was no longer apparent and the clone appeared to be composed of only deep cells (intensely labeled round cells). By 30 h (J), where the enveloping layer subclone should have been, there was tail mesoderm: notochord and muscle. In the head there were the normal dorsal mesodermal fates: hatching gland cells (hgc) and foregut endoderm. |
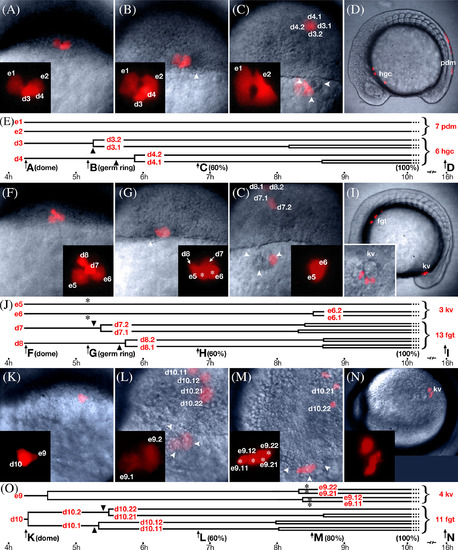
Lineage analysis of dorsal marginal enveloping layer cells. Selected frames from multi‐plane video time‐lapse recordings of embryos containing dorsal enveloping layer subclones. No entire frame has the whole clone in focus; we selected frames that were approximately the best for showing the multiple cells. Enveloping layer cells labeled are with e numbers; deep domain cells, with d numbers. For this analysis, 40 clones were analyzed in 10 planes of focus. No example is shown for unrestricted enveloping layer subclones where both periderm and forerunner fates were produced (six cases). A–E: Example of an enveloping layer subclone restricted to periderm fate, representative of 17 subclone pairs. A: Beginning of recording at doming (4.3 h), when there were two enveloping layer cells and two deep cells (see Supplementary Movie S1). B: At germring (5.7 h), the enveloping layer cells retained their morphology while the two deep cells began to internalize. Nearby, the nascent forerunner cluster was visible (arrowheads). C: At 60% epiboly (6.5 h), the enveloping layer subclone moved over the forerunner cluster whereas the deep subclone ingressed into the prechordal mesendoderm and moved toward the animal pole. Insets show magnified view of enveloping layer subclone. D: At 14 somites (16 h), the enveloping layer subclone was over the tail and became periderm (pdm); the deep subclone was near the head and became hatching gland (hgc). E: Lineage diagram of subclones in A–D; e‐ and d‐numbers refer to cells in above panels; arrows and block letters in timeline refer to panels above and stages are in parentheses. Arrowheads indicate time of deep cell ingression. F–J: Example of enveloping layer subclone restricted to forerunner fate, entering the forerunner cluster at the onset of gastrulation, representative of 6 subclone pairs (see Supplementary Movie S2). No example is shown for cells entering the forerunner cluster both at the onset and midway through gastrulation (4 cases). F: Beginning of recording at doming (4.3 h), when there were two enveloping layer cells and two deep cells. G: At germring (5.7 h), the enveloping layer cells (asterisks) round up as the deep cells ingressed into the mesendodermal layer. H: At 60% (6.5 h) epiboly, the enveloping layer subclone now with changed morphology enters the forerunner cluster; above, the deep subclone has moved into prechordal mesendoderm. Insets show magnified view of enveloping layer subclone. I: At 14 somites (16 h), the enveloping layer clone was in Kupffer's vesicle (kv), whereas the deep subclone was rostral in the foregut (fgt). Additional inset shows magnified view of three cuboidal cells in Kupffer's vesicle. J: Lineage diagram of subclones in F–I, labeled as in E; asterisks indicate time of change from enveloping layer to forerunner cell morphology. K–O: Example of enveloping layer subclones restricted to forerunner fate, entering the forerunner cluster midway through gastrulation, representative of seven subclone pairs. K: Beginning of recording at doming (4.3 h), there was one enveloping layer cell and one deep cell. L: At 60% epiboly (6.5 h), the enveloping layer subclone was over the forerunner cluster but retains an enveloping layer morphology, and the deep subclone has ingressed into the prechordal mesendoderm and moved animalwards. M: At 80% epiboly (8 h), the enveloping layer cells (asterisks) rounded up and clearly displayed forerunner morphology. N: At 14 somites (16 h), the enveloping layer clone was in Kupffer's vesicle (kv); and the deep subclone was in the foregut (fgt), but not visible in this view. Additional inset shows magnified view of three of the four cuboidal cells in Kupffer's vesicle. O: Lineage diagram of subclones in K–O, labeled as in E and J. |
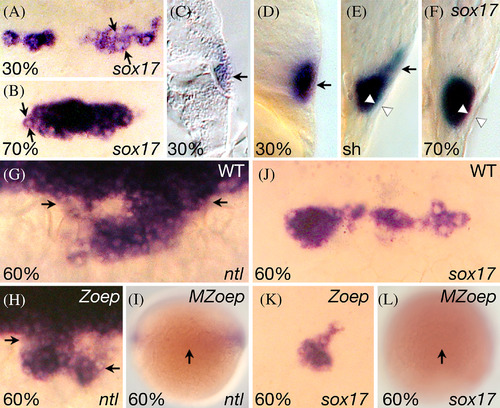
Dorsal marginal enveloping layer cells share characteristics of the dorsal endoderm. A–F. sox17 expression. A,B: Dorsal face views. C–F: Side views. A: 30% epiboly (4.7 h); arrows demarcate a single enveloping cell. B: 70% epiboly (7 h); arrows demarcate a single forerunner cell. C: At 30% epiboly (4.7 h), a cryostat sagittal section showing expression in a single enveloping cell. D‐F: Optical (sagittal) sections on the dorsal axis, (D) 30% epiboly (4.7 h), (E) shield stage (6 h), and (F) 70% epiboly (7 h) showing transition of sox17 expression from dorsal marginal enveloping layer cells to dorsal forerunner cells. Arrow shows expression of surface enveloping layer cells and arrowhead shows unlabeled enveloping layer cells. G–L: Dorsal face views of dorsal forerunner cells at 60% epiboly (6.5 h). ntl (G) and sox17 (J) expression in wild‐type embryos. ntl (H) and sox17 (K) expression in Zoep mutant embryos; and nlt (I) and sox17 (L) expression in MZoep mutant embryos. MZ mutants are shown at lower magnification to show weak expression in the lateral mesendoderm (I) or complete absence of expression (L). Arrows indicate the forerunner cluster or, in the case of its absence, where it should be located. |
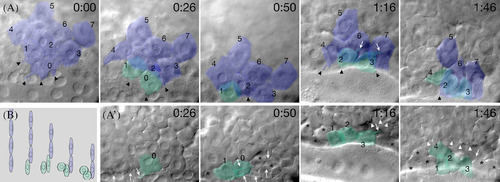
Dorsal enveloping layer cells ingress to form forerunner cells. Selected frames from a multi‐plane video time‐lapse recording of the dorsal margin using DIC bright field optics showing (A) focal plane at the surface and (A′) focal plane 5 µm deeper at the same X, Y location. Individual cells are identified by numbers and elapsed time is indicated in h:min past 30% epiboly (4.7 h). As cells in the enveloping layer (pseudo‐colored blue) round up and loose contact with neighbors, they ingressed (color shift to green) and became forerunner cells, often visible in both planes of focus. Black arrowheads indicate ruffling on enveloping layer cells, white arrows indicate filopodia on forerunner cells, and white arrowheads indicate protrusions on deep domain cells beginning to ingress. Forerunner cells that were not followed are indicated with asterisks (see Supplementary Movie S3). B: Illustration of forerunner cell formation in side view. From left to right are shown the same four cells, as enveloping layer cells at the margin round up, ingress and transform into deep‐like forerunner cells (colored as in A). Data analysis and presentation were performed as described in Kane et al. (2005). |
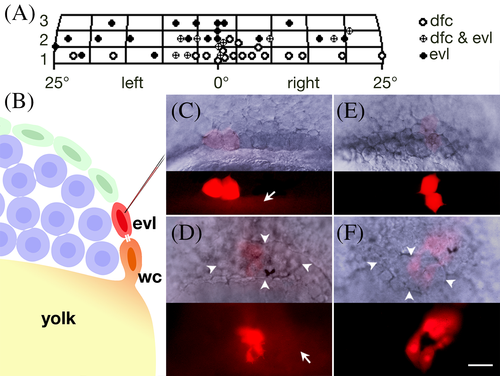
Forerunner cells originate from enveloping layer cells that share lineage with Wilson cells. A: Gastrula fate map for the dorsal forerunner cells. The x‐axis is distance in degrees from dorsal; y‐axis is in cell diameters from the margin. Each grid is roughly the area of a single enveloping layer cell and each symbol plots the location of a single enveloping layer subclone, typically the average location of two cells. B–F: Forerunner cells derive from enveloping layer cells coupled to a Wilson cell. B: Experimental design. Injection into an enveloping layer cell (evl) at the 512‐cell stage (3 h) to determine whether it is dye‐coupled through a midbody (white bars) to a Wilson cell (wc) and indirectly to the yolk cell. Enveloping layer cells are green, deep cells are blue, Wilson cells have orange nuclei and the yolk is yellow. C: An enveloping layer cell (after its division) that was coupled to a 512‐cell stage (3 h) Wilson cell. Arrow indicates dye coupling to yolk cell. D: At 60% epiboly (6.5 h), this clone contributed progeny to the forerunner cluster (arrowheads). Of 42 such clones, 15 produced unrestricted clones that included forerunners, and 22 produced restricted forerunner clones; the remaining 5 produced restricted periderm clones. Arrow indicates dye coupling to yolk cell. E: An enveloping layer cell (after its division) not coupled to a 512‐cell stage (3 h) Wilson cell. F: At 60% epiboly (6.5 h), this clone contributed progeny to enveloping layer cells over the forerunner cluster. Of 38 such clones, 36 produced restricted periderm clones; the remaining 2 produced unrestricted clones that included forerunner derivatives. |
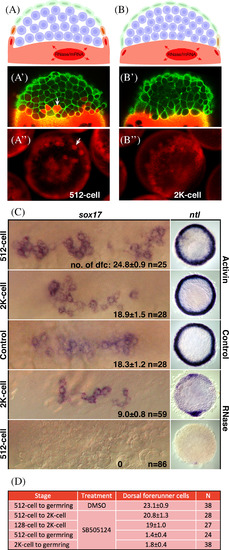
Yolk cell cytoplasm is necessary for forerunner fate. A,B: Experimental design and examples. Injection of lineage tracer dye into the yolk cell at the 512‐cell stage (3 h, A), when Wilson cells are present, the dye not only incorporates into the yolk cell, but also into Wilson cells and the cells that they are bridged to (white bars). Injection into the yolk cell at the 2K‐cell stage (3.5 h, B), after Wilson cells collapse to form the yolk syncytial layer, shows dye only incorporates into the yolk cell or very weakly into enveloping layer cells that were once coupled to a Wilson cell. A′,B′: Confocal images of transgenic embryos carrying Tg(β‐actin: utrophin‐GFP) to outline cells in green and injected with red lineage tracer as for A and B. White arrow indicates one marked cell in the 512‐cell stage embryo, there are many others in this plane of focus, but no marked cells in the 2K‐cell stage embryo. A″,B″: Images of experimental embryos injected as for A and B, and, in this example, with RNaseA. White arrow indicates one marked cell in the 512‐cell stage embryo, there are many others in this embryo. Robust labeling around the blastoderm margin in the 2K‐cell stage embryo is in the yolk syncytial layer. C: Results of injections with Activin mRNA and RNaseA. Views for sox17 are face views at higher magnification and views for ntl are animal pole views, dorsal oriented down. Injection of Activin mRNA at the 2K‐cell stage had no effect on the number of sox17 positive dorsal forerunner cells or expression of ntl in the presumptive mesendoderm at 50% epiboly, but injection at the 512‐cell stage (3 h) caused an approximate 40% increase in the number of dorsal forerunner cells and a marked expansion of presumptive mesendoderm. Injection of RNaseA at the 2K‐cell stage (3.5 h) reduced the number of sox17 positive dorsal forerunner cells by approximately 50% and decreased the expression of ntl in the presumptive mesoderm at 50% epiboly (5.3 h) all but dorsally, but injection at the 512‐cell stage (3 h) abolished the dorsal forerunner cells altogether and almost all presumptive mesendoderm except a smidgen dorsally. D: Effects of inhibiting the Nodal‐signaling pathway with SB‐505124 or DMSO (control) at the times indicated. Dorsal forerunner cells were visualized and counted at 50% epiboly using sox17 expression as shown above. Their numbers are shown as average ± SE; N is number of embryos. There is little effect on blocking the Nodel signaling pathway between the 512‐cell to 2K‐cell stage, but blocking after the 2K‐cell stage prevents dorsal forerunner cells from forming. |