
- Title
-
Distant Insulin Signaling Regulates Vertebrate Pigmentation through the Sheddase Bace2
- Authors
- Zhang, Y.M., Zimmer, M.A., Guardia, T., Callahan, S.J., Mondal, C., Di Martino, J., Takagi, T., Fennell, M., Garippa, R., Campbell, N.R., Bravo-Cordero, J.J., White, R.M.
- Source
- Full text @ Dev. Cell
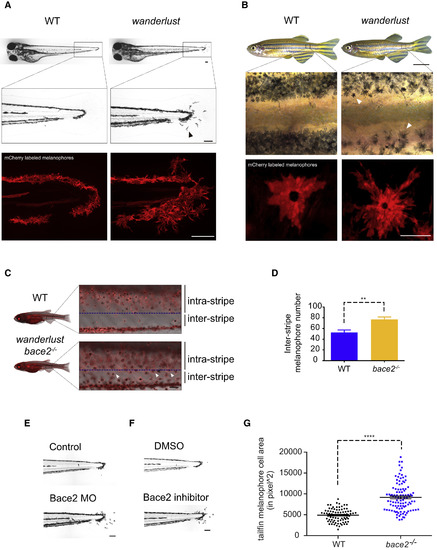
The Zebrafish Wanderlust Mutant Has Hyperdendritic Melanophores due to a Loss of Bace2 (A) Brightfield imaging shows that the wanderlust melanophores are hyperdendritic compared with WT fish (arrowhead) in the tail fin at 72 hpf. Labeling of the melanophore cell membranes (bottom panel) using the Tg(tyrp1b: membrane-mCherry) line demonstrates that this is due to a change in cell morphology rather than a redistribution of melanin. (B) These hyperdendritic melanophores are maintained into adulthood, and yield irregular stripe boundaries (arrowhead). (C and D) wanderlust mutants develop melanophores outside of the stripe during metamorphosis at 24 days post fertilization (dpf) (arrowhead). Inter-stripe melanophores number are quantified in (D); fish number: n(WT) = 5, n(wanderlust) = 5, two-tailed t test, ∗∗p < 0.01. (E and F) Bace2 loss of function using morpholino knockdown (E) or pharmacological inhibition (F) phenocopies the wanderlust mutant. WT embryos are treated with Bace2 inhibitor (PF-06663195,100 μM) from 48 to 72 hpf. (G) bace2−/− melanophores have larger cell area in the tail fin at 72 hpf. Melanophore cell area is defined as the surface area covered by melanophores in the tailfin. Data are from five independent experiments, with total fish numbers: n(WT) = 80, n(bace2−/−) = 105, two-tailed t test, ∗∗∗∗p < 0.0001. All bar graphs are presented as means ± SEM. Scale bars: (A, B middle and bottom, C, E, and F) 100 μm; (B top) 0.5 cm. See also Figure S1. EXPRESSION / LABELING:
PHENOTYPE:
|
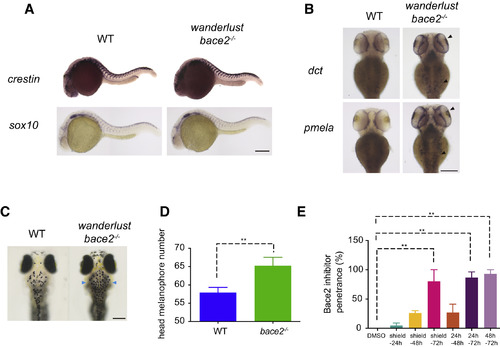
Bace2 Acts during Melanophore Differentiation (A) At 24 hpf, ISH shows the bace2−/− mutants have unaffected expression for neural crest markers crestin and sox10. (B) But at 72 hpf, ISH shows mRNA for the pigmentation genes dct and pmela are elevated in bace2−/− mutants, especially in the head (arrowhead). (C and D) Consistently, bace2−/− mutants have increased numbers of pigmented melanophores in the head (arrowhead). Fish number n(WT) = 55, n(bace2−/−) = 30, two-tailed t test, ∗∗p < 0.01. (E) Treatment of WT embryos with 100 μM Bace2 inhibitor (PF-06663195) from 48 to 72 hpf is sufficient to phenocopy bace2−/−. Data are from two independent experiments, with total fish numbers: n(DMSO) = 21, n(shield-24h) = 45, n(shield-48h) = 56, n(shield-72h) = 72, n(24h-48h) = 58, n(24h-72h) = 40, n(48h-72h) = 49; one-way ANOVA followed by Holm-Sidak's multiple comparisons test, ∗∗p < 0.01. All bar graphs are presented as means ± SEM. Scale bars, 200 μm. See also Figures S1 and S2. EXPRESSION / LABELING:
PHENOTYPE:
|

Bace2 Acts Cell Intrinsically within the Melanophore Lineage (A) At 24 hpf in WT embryos, double-fluorescent ISH against the pan neural crest marker crestin (green) and bace2 (red) shows bace2 expression overlaps with crestin, suggesting bace2 is highly enriched in the neural crest lineage from which the melanophores are derived. (B–D) Melanophore-specific transgenic rescue of the bace2−/− mutant. A stable transgenic line was created in which the dct promoter drives Bace2 in the melanophores (along with a cryaa: yellow fluorescent protein (YFP) transgene marker). Founders were identified by expression of the YFP marker in the eye. Founders were crossed into other uninjected bace2−/− adults to generate F1 embryos. F1 embryos were scored for dendritic tail melanophore rescue at 3 dpf (B, arrowhead) or for rescue of the head melanophores at 5 dpf. F1 embryos were divided into four groups: rescued, non-rescued, YFP positive, and YFP negative. Chi-square with Yate's correction was performed to associate rescue phenotype with YFP-positive eye (quantified in C and D). ∗∗∗p < 0.001, ∗∗∗∗p < 0.0001. (E–G) The zebrafish melanoma cell line ZMEL1 was treated with 12.5 μM or 25 μM of the Bace2 inhibitor PF-06663195 for 72 hr, and resulted in hyperdendritic cells (arrowhead) similar to what was seen in vivo. A representative field of cells is shown in (E) and dendricity is quantified as an increase in cell length to width ratio (F), along with an increase in overall cell number (G). Data are from three independent experiments, one-way ANOVA followed by Holm-Sidak's multiple comparisons test, ∗∗∗∗p < 0.0001. (H) The increased cell number induced by Bace2 inhibitor is due to increased ZMEL1 cell proliferation, as measured by increased phospho-histone H3 (pH3) immunostaining. Data are from three independent experiments, one-way ANOVA followed by Holm-Sidak's multiple comparisons test, ∗∗∗p < 0.001, ∗∗∗∗p < 0.0001. (I) ZMEL1 treated with 25 μM of the Bace2 inhibitor PF-06663195 for 48 hr have increased migration in Transwell assay. Data are from five independent experiments, two-tailed t test, ∗∗∗p < 0.001. All bar graphs are presented as means ± SEM. Scale bars: (A 120× and E) 10 μm; (A 40×) 30 μm, (A 10× and B, left) 100 μm, and (B, right) 200 μm. EXPRESSION / LABELING:
PHENOTYPE:
|
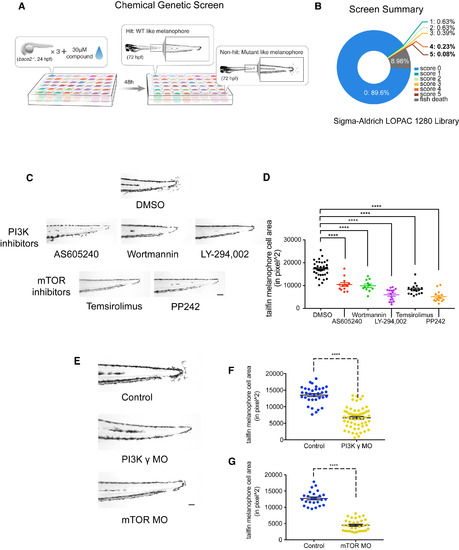
Bace2 Regulates Melanophore Dendricity via PI3K/mTOR Signaling (A) Scheme for chemical suppressor screen of the bace2−/− mutant; 24 hpf bace2−/− embryos were treated with each compound from the Sigma LOPAC 1280 library at 30 μM for 48 hr, in order to identify chemicals that could rescue the melanophore defects. (B) Compounds were scored with a range of 0 (non-rescued, mutant-like) to 5 (fully rescued, WT-like). (C) Top hits from the screen (with score of 4 and 5) converge on PI3K/mTOR signaling pathway. PI3K inhibitors AS605240 (110 nM), Wortmannin (230 nM), LY-294,002 (15 μM), and mTOR inhibitors Temsirolimus (30 μM), and PP242 (15 μM) all fully rescue the bace2−/− hyperdendritic melanophores. (D) Quantification of tailfin melanophore cell area at 72 hpf with hits from the screen (n = each fish, one-way ANOVA followed by Holm-Sidak's multiple comparisons test, ∗∗∗∗p < 0.0001). (E–G) Morpholinos knockdown of the PI3K γ isoform and mTOR in bace2−/− mutants rescue the phenotype analogous to what is seen with compounds from the screen, and the resulting tailfin melanophore cell area is quantified in (F) and (G). The data are from three independent experiments. Uninjected bace2−/− siblings (Control) are scored in the same manner, two-tailed t test, ∗∗∗∗p < 0.0001. All bar graphs are presented as means ± SEM. Scale bar, 100 μm. See also Figures S3–S5. PHENOTYPE:
|

bace2−/− Mutants Have Increased PI3K/mTOR Activity (A–D) Immunostaining against phospho-S6 ribosomal protein (p-S6), a downstream readout of PI3K/mTOR activity, shows elevated p-S6 signal that overlaps with fluorophore-labeled melanophores at 48 hpf (B) and 72 hpf (C). A representative picture of 72 hpf is shown in (D) and overlapping signals are marked by arrowhead. The data are from three (A), five (B), and five (C) independent experiments, two-tailed t test, ∗∗∗∗p < 0.0001, ns = not significant. All bar graphs are presented as means ± SEM. Scale bar, 50 μm. EXPRESSION / LABELING:
PHENOTYPE:
|
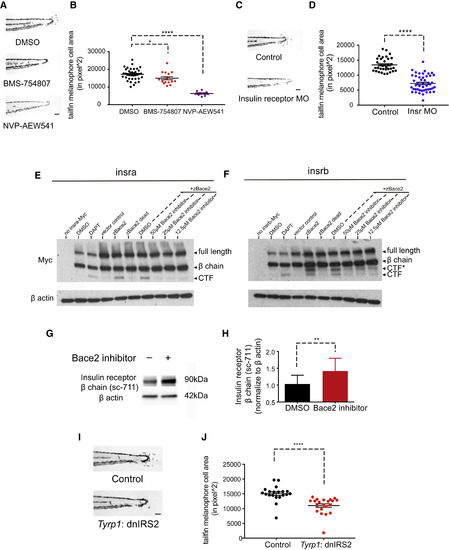
The Insulin Receptor Is a Substrate for Bace2 and Regulates Melanophore Dendricity (A and B) Inhibition of the insulin receptor in bace2−/− embryos using the insulin receptor inhibitors BMS-754807 (7.5 μM) and NVP-AEW541 (60 μM) rescue the hyperdendritic melanophores in the mutant, quantified in (B). bace2−/− embryos are treated from 24 to 72 hpf, and the data are from three independent experiments. One-way ANOVA followed by Holm-Sidak's multiple comparisons test, ∗p < 0.1, ∗∗∗∗p < 0.0001. (C and D) Morpholino knockdown of insulin receptor (Insr) in bace2−/− embryos rescues the hyperdendritic melanophores, quantified in (D). Insra and insrb morpholinos were coinjected into bace2−/− embryos to deplete all insulin receptors. The data are from three independent experiments, two-tailed t test, ∗∗∗∗p < 0.0001. (E and F) Bace2 cleaves the insulin receptor. Expression of zebrafish Insra-Myc (E) and Insrb-Myc (F) fusion protein in HEK293T cells give rise to full-length insulin receptor and the β chain. Inhibition of γ secretase using DAPT (2 μM, 24-hr treatment) prevents the CTF from being cleaved, leading to CTF accumulation. Expression of zebrafish Bace2 (zBace2) on top of the Insra-Myc fusion protein leads to production of single CTF band (E). zBace2 addition leads to the production of two fragments from Insrb-Myc, one that migrates similarly to the CTF and additional larger fragment designated as CTF∗ (F). This is not seen with the enzymatic dead version of Bace2 (zBace2 dead) or after Bace2 inhibition with PF-06663195 (24-hr treatment). zBace2 dead was constructed by site-mutagenesis of two conserved catalytic sites aspartic acids into alanines (D98A and D292A). (G and H) Bace2 inhibition with PF-06663195 (25 μM, 24-hr treatment) in ZMEL1 cells, which normally express both Bace2 and the insulin receptor, leads to accumulation of endogenous insulin receptor β chain, quantified in (H). The data are from five independent experiments, two-tailed t test, ∗∗p < 0.01. (I and J) Melanophore-specific inhibition of insulin signaling in bace2−/− mutants rescues melanophores hyperdendricity in the tailfin. A mosaic F0 transgenic line was created in which the fugu tyrp1 promoter drives dominant-negative insulin receptor substrate 2 (dnIRS2) fused to EGFP in the melanophores (along with a cmlc2: mCherry transgene marker). At 72 hpf, tailfin melanophore cell area was quantified in uninjected control (Control) and transgene-positive injected embryos (J). The data are from three independent experiments, two-tailed t test, ∗∗∗∗p < 0.0001. All bar graphs are presented as means ± SEM. Scale bar, 100 μm. See also Figures S5 and S6. PHENOTYPE:
|

Insulin b Is the Upstream Ligand that Drives Melanophore Dendricity in Wanderlust (A and B) Morpholino knockdown of the ligand insulin B (insb) in bace2−/− embryos rescues the hyperdendritic melanophores, quantified in (B). The data are from three independent experiments, two-tailed t test, ∗∗∗∗p < 0.0001. (C–E) Fluorescent ISH shows zebrafish insb ligand mRNA is initially expressed ubiquitously at 24 hpf and then restricted to the head/brain region (arrowhead) in bace2−/− embryos at 48–72 hpf, sense probe controls for background signal. All bar graphs are presented as mean ± SEM. Scale bars: (A) 100 μm, (C and D) 150 μm, and (E) 200 μm. See also Figures S5 and S7. EXPRESSION / LABELING:
PHENOTYPE:
|
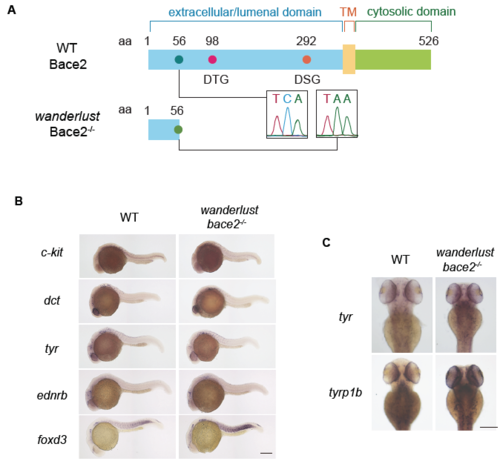
Related to Figure 1 and 2: bace2-/- mutants have increased mRNA expression of pigmentation genes. (A) Schematic representation of zebrafish WT and Bace2-/- protein as found in the wanderlust mutant. Zebrafish Bace2 is a type I integral membrane β secretase that contains two DTG and DSG protease sites within its extracellular/lumenal domain. The wanderlust mutant (Bace2-/-) has a C to A nonsense mutation leading to a truncated protein with size of 56 amino acids (aa), lacking both protease sites. TM=Transmembrane domain. (B-C) ISH shows no detectable difference in neural crest or melanophore genes expression between WT and bace2-/- fish at 24 hpf (B), but ISH shows pigmentation genes are elevated in bace2-/- fish at 72 hpf (C). Scale bars, 200μM. |
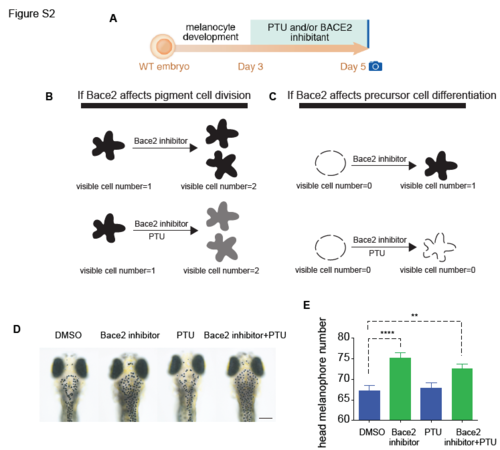
Related to Figure 2: Bace2 deficiency leads to increased melanophore cell division. (A) Schema for testing the mechanism of increased melanophore cell number when Bace2 is loss. WT embryos were treated from 3-5dpF with 300μM PTU and/or 100μM Bace2 inhibitor (PF-06663195). PTU is a tyrosinase inhibitor that prevents new melanin synthesis to allow visualization only of previously pigmented melanophores. (B-C) Schema for two possible scenarios. If Bace2 loss of function induces pigment cell division as shown in (B), co-treatment with the Bace2 inhibitor and PTU would still increase melanophore cell number the same way as Bace2 inhibitor treatment alone. This is because PTU would not affect pre-existing melanin and the newly derived daughter cells would inherit melanin from their mother cell. If Bace2 loss of function induces differentiation of unpigmented precursor cells as shown in (C), co-treatment with the Bace2 inhibitor and PTU would not increase visible melanophores cell number, as PTU would inhibit any new melanin from synthesis. (D-E) Co-treatment with the Bace2 inhibitor and PTU led to an increase in the number of pigmented melanophores, which necessarily must have come from previously pigmented cells division due to the effects of PTU, quantified in (E). The data are from three independent experiments, one-way ANOVA followed by Holm-Sidak's multiple comparisons test; fish number n(DMSO)=53, n(Bace2 inhibitor)=56, n(PTU)=54, n(Bace2 inhibitor+PTU)= 61. **P<0.01, ****P<0.0001. Epinephrine (5mg/ml) was used to aggregate melanin to facilitate cell counting. All bar graphs are presented as mean ± s.e.m. Scale bars, 200μM. |
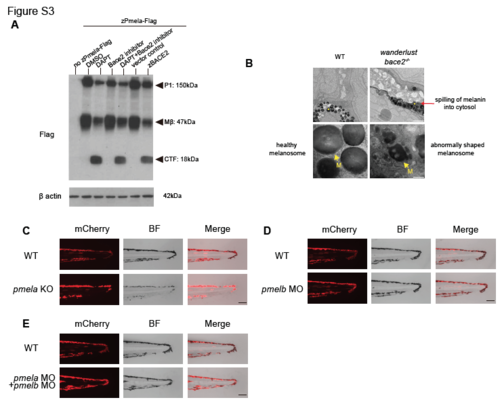
Related to Figure 4: Pmel is a substrate for Bace2 but is not responsible for the wanderlust phenotype. (A) zebrafish Bace2 cleaves Pmela. We constructed a fusion protein of zebrafish Pmela and a C-terminal Flag tag to detect cleavage by immunoblotting using Flag antibody. Expression of the fusion protein in HEK 293T cells reveals an immature core-glycosylated P1 form of Pmela (~150 kDa), the Mβ (~47 kDa), and the CTF (~18 kDa) when treated with γ secretase inhibitor DAPT (1μM), in a similar manner to human PMEL protein. Inhibition of human BACE2 using BACE inhibitor IV (1μM) increases the relative abundance of Mβ and decreases the abundance of the CTF, suggesting Bace2 cleaves Mβ and gives rise to CTF. Co-expression of the fusion protein and zebrafish Bace2 (zBACE2) leads to accumulation of cleavage product CTF, suggesting zebrafish Bace2 is sufficient to cleave zebrafish Pmela. (B) Electron microscopy of 72hpf embryos tail melanophores showed a difference in melanin distribution as well as melanosome (M) shape. Melanosomes in WT are round with a smooth outline and homogeneously filled with melanin (yellow arrow). bace2-/- melanophores have a darker hue in the cytosol (red arrow) and irregular melanosome membrane (yellow arrow), suggesting a leakage of melanin out of melanosomes into the cytosol. (C) Knockout of pmela using CRISPR-Cas9 in WT zebrafish leads to pale but not dendritic melanophores, similar to previously published fading vision mutant. This suggests that loss of pmela does not result in hyperdendritic melanophores. Melanophore membrane structure is visualized using Tg(tyrp1b: membrane- mCherry) strain at 3dpF. (D-E) Knockdown of pmelb alone (D) or co-knockdown of pmela and pmelb (E) using morpholinos in WT embryos does not lead to the hyperdendritic melanophore phenotype as seen in the bace2-/- mutant. Scale bars, 100 nM (B bottom panel), 1μM (B top panel), 100μM (C-E). PHENOTYPE:
|
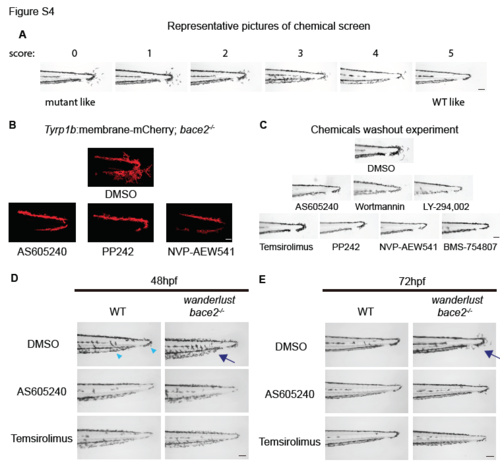
Related to Figure 4 and Figure 6: PI3K/mTOR inhibition rescues dendritic melanophores in bace2-/-. (A) Representative pictures of melanophores with chemical screen scores from 0 (non-rescued, mutant like) to 5 (fully rescued, WT like). (B) Confocal pictures high magnification view of tailfin melanophores in response to PI3K inhibitor AS605240 (110nM), mTOR inhibitor PP242 (15μM) and insulin receptor inhibitor NVP-AEW541 (60μM). Tg(tyrp1b: membrane- mCherry) fish were treated from 24hpf to 72hpf to visualize melanophore membrane structure. Also see Supplemental Movie 1-4. (C) PI3K/mTOR/Insulin receptor inhibitors effect on tail melanophore phenotype is not reversible by drug washout. wanderlust mutants were treated with inhibitors from 24hpf to 72hpf, then inhibitors were washed off extensively and embryos were imaged at 108hpf. (D-E) bace2-/- is hypersensitive to PI3K/mTOR inhibition compared to WT fish. PI3K/mTOR inhibition reduced WT melanophore dendricity at 48hpf (D, arrowhead), but the bace2-/- melanophores are more sensitive to this effect at both 48hpf and 72hpf (D and E, arrow). Treatment of WT and bace2-/- embryos with the PI3K inhibitor AS605240 (110nM) or mTOR inhibitor Temsirolimus (30μM) from 24-48hpf (D) or from 24-72hpf (E). Scale bars, 30μM (B), 100μM (A, C, D, E). |
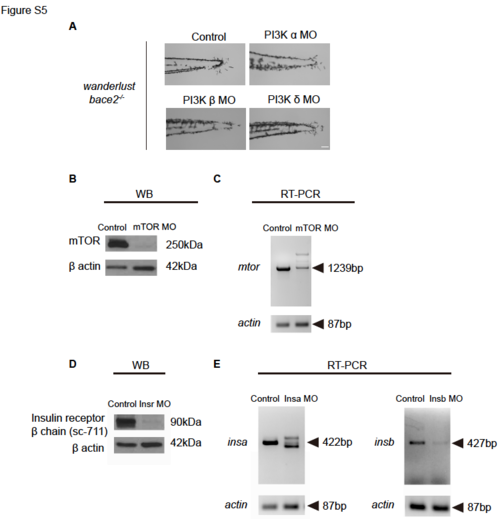
Related to Figure 4, 6, 7: Control experiments for morpholino knockdown. (A) Knockdown of PI3K α, β or δ isoforms using morpholinos does not rescue bace2-/- dendritic melanophores to the same extent as PI3K γ morpholinos, as shown in Figure 4E. (B) Knockdown of mTOR using mTOR splicing morpholino leads to depletion of mTOR protein in Western blot. Membrane probed with anti-mTOR antibody and β-actin as a loading control. (C) RT-PCR shows knockdown of mTOR using mTOR splicing morpholino leads to abnormal mRNA splicing. mtor fragment is amplified using primers adjacent to morpholino target sites. actin: input control. (D) Western blot shows co-knockdown of insra and insrb using morpholinos leads to decrease insulin receptor protein. Membrane probed with antibody sc-711 recognizing insulin receptor β chain and β-actin as a loading control. (E) Knockdown of insa (Left) and insb (Right) using splicing morpholinos lead to abnormal mRNA splicing and expression in RT-PCR. Fragments are amplified using primers adjacent to morpholino target sites. actin: input control. Scale bars, 100μM. |
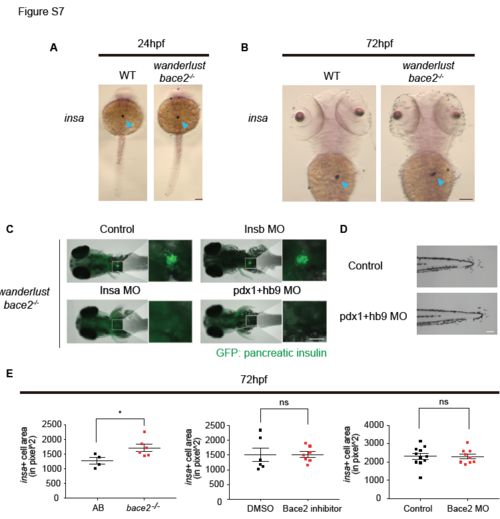
Related to Figure 7: Pancreatic insa ablation does not rescue the bace2-/- phenotype. (A-B) ISH shows insa mRNA is specifically expressed in pancreas at 24hpf (A) and at 72hpf (B) for both WT and bace2-/- embryos (arrowhead). (C) Immunostaining shows knockdown of either insa or pdx1/hb9 in bace2-/- mutants completely ablates insulin staining in the pancreas, while insb knockdown does not change pancreatic insulin level at 72hpf. Whole embryos were stained with anti-insulin antibody. (D) Co-knockdown of pdx1 and hb9 in bace2-/- mutants fails to rescue dendritic melanophores at 72hpf. (E) wanderlust mutant have slightly increased insa positive cell area compared to WT embryos at 72hpf, but Bace2 inhibitor and Bace2 morphant do not show significant differences to the control group, suggesting Bace2 loss of function does not consistently alter pancreatic β cell mass at 72hpf. n=each fish, two-tailed t test, *P<0.05. All bar graphs are presented as mean ± s.e.m. Scale bars, 50μM (C), 100μM (A, B, D). |
Reprinted from Developmental Cell, 45(5), Zhang, Y.M., Zimmer, M.A., Guardia, T., Callahan, S.J., Mondal, C., Di Martino, J., Takagi, T., Fennell, M., Garippa, R., Campbell, N.R., Bravo-Cordero, J.J., White, R.M., Distant Insulin Signaling Regulates Vertebrate Pigmentation through the Sheddase Bace2, 580-594.e7, Copyright (2018) with permission from Elsevier. Full text @ Dev. Cell