
- Title
-
Feedback between tissue packing and neurogenesis in the zebrafish neural tube
- Authors
- Hiscock, T.W., Miesfeld, J.B., Mosaliganti, K.R., Link, B.A., Megason, S.G.
- Source
- Full text @ Development
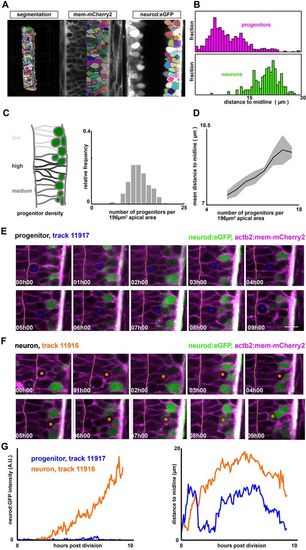
The neural tube is a densely packed and dynamic pseudostratified epithelium. (A) Analysis pipeline: membrane-labeled images are segmented and cropped using custom scripts to generate 3D cell meshes for the entire neural tube. Each mesh is then classified as a neuron or a progenitor, according to the expression level of the neural marker (neurod:eGFP) (see also Fig. S1C). (B) Distance of cell centroid position to the midline, for both progenitors and neurons. (C) Progenitor density (per unit apical area) varies significantly across the neural tube, even at the same dorsal-ventral position. Shown are measurements of progenitor number collected in a 14×14 µm section of apical area collected from different embryos across a range of anterior-posterior positions. (D) Regions of high progenitor density correlate with regions where progenitors are located far from the midline (data are mean±s.e.m.). (E,F) Representative cell tracks from GoFigure2, following two sister cells. (E) A cycling progenitor. Scale bar: 10 µm. (F) A nascent neuron. Orange and blue circles indicate one of the daughter cells from the mitotic cell. Dotted line indicates the midline (apical surface) (see also Movie 1). (G) neurod:eGFP intensity (left) and nuclear position (right) as a function of time for the two cells shown in E,F. |
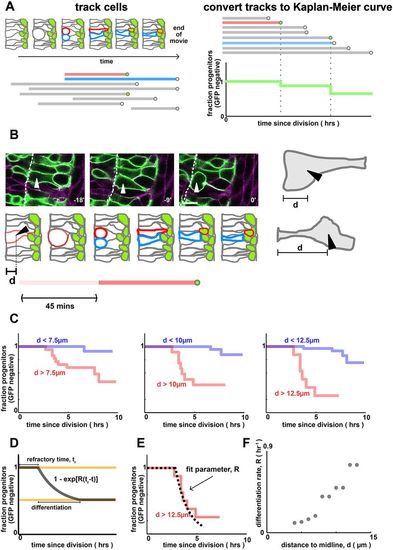
Progenitors that are far from the apical surface differentiate more frequently. (A) Quantifying cell-tracking data using Kaplan–Meier curves. Cells are manually tracked over time (schematic, upper left). Tracks begin at mitosis and end when (i) the cell turns on GFP (i.e. differentiates, see the red cell track), (ii) divides or (iii) becomes untrackable/moves out of frame (see the blue cell track). This generates an ensemble of tracks (lower left). To calculate the Kaplan–Meier curves, we align all tracks to begin at the same time, order them by length and, for each timepoint, compute the probability that progenitors remain GFP negative (right). (B) Quantification of pre-mitotic cell shape by distance to midline, d. Scale bar: 10 µm. Arrowhead shows a cell entering mitosis. Dashed line indicates the apical surface. (C) Single-cell tracking reveals that cells that are far from the apical surface pre-division turn on neurod more rapidly than those that are close. The dependence of differentiation rate on cell shape is independent of the threshold value that defines which cells are ‘far’ and which cells are ‘close’. P=0.01 (left), P=1e-6 (middle) and P=1e-7 (right). Data are from n=46 cells and n=3 embryos. The number of cells closer/further than each distance threshold is: 24/22 (7.5 µm), 34/12 (10 µm) and 38/8 (12.5 µm). (D) A simple model for differentiation, where for some time windows each cell differentiates at a constant rate per unit time, R (the differentiation rate). (E) Numerical fit of the model in D to the data in C to infer the differentiation rate parameter R. The dotted line refers to the best fit model. (F) Differentiation rate parameter, R, as a function of the distance to midline, d. |
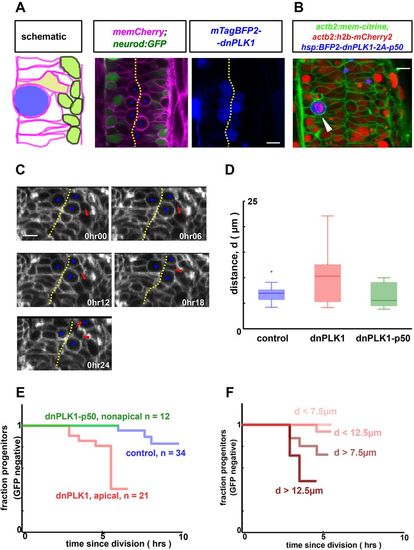
Pushing progenitors away from the apical surface by an arrested mitotic cell promotes their differentiation. (A) Cell shapes are perturbed by inducibly and mosaically arresting neighboring cells in mitosis by using a heat shock-inducible dnPLK1 construct that prevents mitotic exit. Scale bar: 10 µm. (B) Arrested mitotic cells can be nonapical (arrowhead) when p50 is co-expressed with dnPLK1. h2b-mCherry demonstrates condensed chromosomes, hence mitotic entry. Scale bar: 10 µm. (C) Arrested cells (blue dots) crowd the apical surface, pushing neighboring unperturbed cells away (red arrowhead). These cells still approach the midline to divide (last frame) and are then tracked to monitor differentiation status. Note that banding artifacts and pixellation visible in these panels result from data acquisition and processing methods (see Materials and Methods). Scale bar: 10 µm. (D) Cells adjacent to the arrested mitotic cell are shifted basally (P<0.01, n=10 for dnPLK1, n=26 for control). Here, d is the distance to the apical surface prior to division, as measured in Fig. 2. In contrast, progenitors remain apical when adjacent to dnPLK1-p50 arrested non-apical mitotic cells (P=0.6). (E) Tracking of single cells adjacent to an arrested mitotic cell reveals a significant increase in differentiation (P<0.01) compared with control (data from the same experiment as Fig. 2). In contrast, non-apical mitotic cells do not induce differentiation of their neighbors (P=0.8, n=12 versus control). (F) Single-cell tracking reveals the same correlation between cell shape and neurod dynamics as in Fig. 2 for cells adjacent to arrested mitotic cells (using the n=21 tracked dnPLK1 cells). |
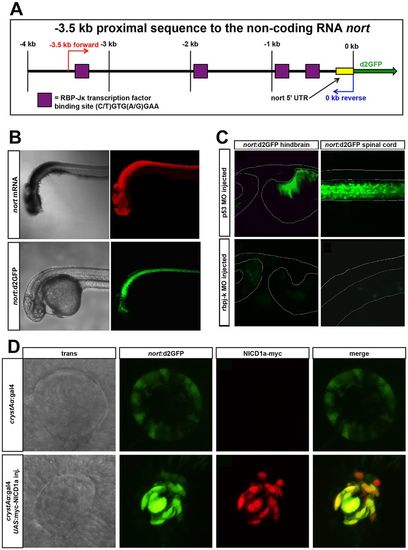
A nort transgenic reporter for Notch activity. (A) Schematic of the 3.5 kb nort proximal promoter. This region contains four canonical rbpj-K-binding sites. (B) nort mRNA (red) and nort:d2GFP (green) transgene expressed in the same tissues at 30 hpf. (C) nort:d2GFP expression was reduced in a rbpj-k MO-injected 48 hpf hindbrain and spinal cord compared with the p53 MO-injected controls. The morphology of the hindbrain was similar to the controls, whereas the rbpj-k MO-injected spinal cord was curved. (D) Normal expression of nort:d2GFP is found in the lens epithelium. Overexpression of myc-NICD1a in the lens using crystAα:gal4 causes enhanced ectopic nort:d2GFP expression. Myc immunofluorescence colocalizes with upregulated d2GFP at 28 hpf. |
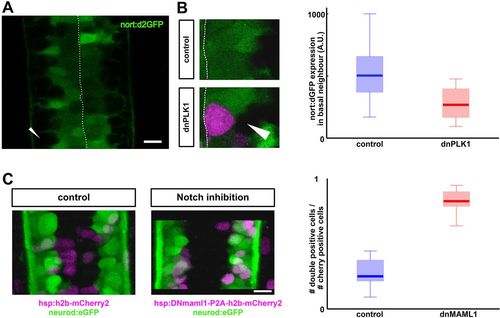
Notch activity as a potential readout of nuclear position. (A) nort:d2GFP expression reports Notch activity in the neural tube. Arrowhead indicates GFP-negative basally localized neurons. Scale bar: 10 µm. (B) Notch activity (green) is significantly inhibited in progenitors that are adjacent (and basal) to an arrested mitotic cell (magenta) (P<0.01, n=15 for control, n=12 for dnPLK1). (C) Inhibition of Notch signaling (via microinjection of hsp:dnMAML1-P2A-h2bCherry2) promotes differentiation compared with a control injection (hsp:h2bCherry2) (P<0.001 for n=11). Scale bar: 10 µm. |
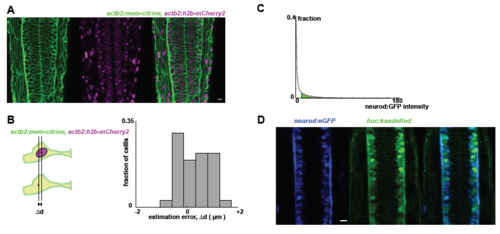
A: Embryos doubly transgenic for a membrane and nuclear label (mem-citrine and h2b-mCherry2) reveal the densely-packed pseudostratified epithelial character of the neural tube. B: We compared nuclear position (based on h2b signal) with the cell centroid position (based on the citrine signal), both manually identified. We find that the difference between these two measurements ("the estimation error") is rather small (mean value < 1μm). C: Tg(neurod:eGFP) is used to classify neurons versus progenitors. Cells are segmented, and the median GFP intensity is calculated per cell (the median, rather than the mean, is robust to scatter of GFP signal from high intensity neighboring cells). Neurons are identified as having a median GFP intensity higher than a certain threshold, defined manually by referencing the raw images, and is fixed for all samples for the same experiment. D: Neurod:eGFP levels (left) correlate well with HuC:Kaede levels (right), in a 28hpf embryo. For randomly selected cells in the neural tube, we find that neurod status (defined manually as positive or negative) is similar to huc status (similarly defined). Specifically, most cells (28/30) are either neurod+/huc+ or neurod-/huc-. |
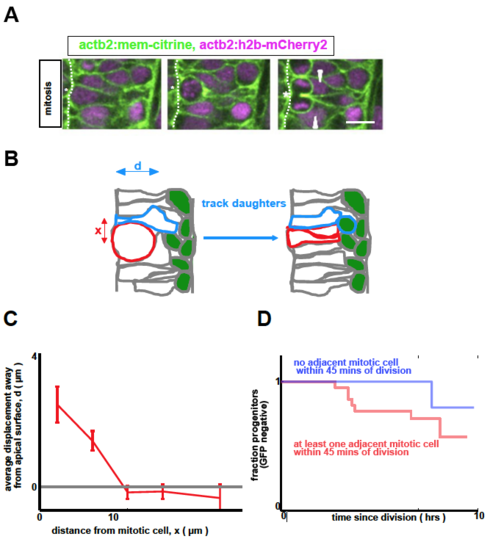
A: Endogenous mitotic cells physically deform their neighbors, depicted in a montage of images separated by 9 minutes per frame. Asterisk denotes mitotic cell ending cytokinesis; arrowheads denote perturbed adjacent cells. (Scale bar: 10μm) B: Mitotic cells transiently push their neighbors away from the apical surface (schematic). C: We measure the maximal basal displacement moved by a given cell as a result of a nearby division. We also record the distance x μm along the apical surface between the measured cell and the mitotic cell. We then group the data according to x, and plot the mean and standard error as shown. D: By tracking progenitors, we see a small, but not significant (p = 0.1) difference in differentiation rate when comparing cells that are or are not adjacent to dividing cells within 45-60 minutes of their own division (n=58, same movies as in Figure 2). |
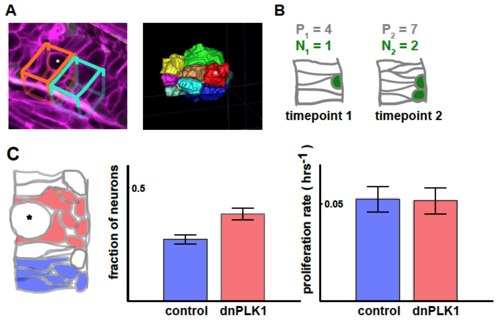
A: Left: We compare regions adjacent to a mitotic cell (15 μm x 15 μm apical surface, manually contoured) [orange], to nearby control regions of the same dimensions but without an arrested cell [cyan]. Single cell tracking reveals that there is little movement of cells along AP/DV that would take them out of the regions (~2.6μm mean distance moved). Right: segmented image. Asterisks depict an arrested mitotic cell. B: Illustrative calculation. We define the fraction of neurons as , i.e. for the right . We define the proliferation rate between the two timepoints as: . (C) There is an increased fraction of neurons adjacent to arrested mitotic cells (red) compared to control regions without an arrested cell (blue) (p < 0.01). Proliferation rates are similar in the two cases (right) (p = 0.9). (n = 7 for both cases) |
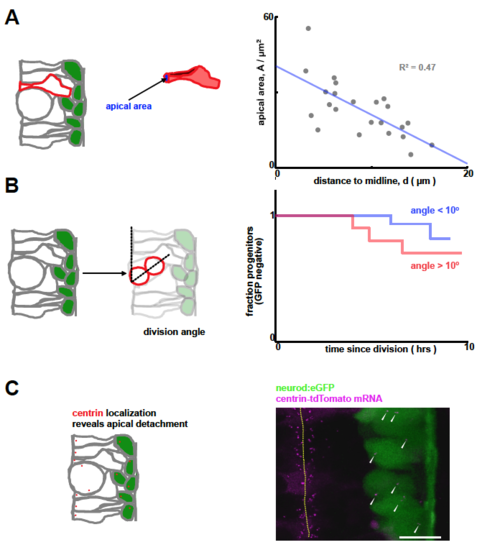
A: Apical area negatively correlates with distance to midline at the single cell level. B: Differentiation curves for parallel (angle < 10°) and oblique (angle > 10°) division events reveal a small, but not significant effect of division orientation on division rate (p = 0.3). C: High resolution, high gain images of Tg(neurod:eGFP) transgenics reveal that some neurod+ cells retain a connection to the apical surface, demonstrating that apical detachment is not required for neurod expression. |