
Fig. S1
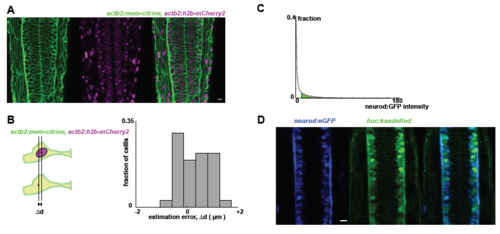
A: Embryos doubly transgenic for a membrane and nuclear label (mem-citrine and h2b-mCherry2) reveal the densely-packed pseudostratified epithelial character of the neural tube. B: We compared nuclear position (based on h2b signal) with the cell centroid position (based on the citrine signal), both manually identified. We find that the difference between these two measurements ("the estimation error") is rather small (mean value < 1μm). C: Tg(neurod:eGFP) is used to classify neurons versus progenitors. Cells are segmented, and the median GFP intensity is calculated per cell (the median, rather than the mean, is robust to scatter of GFP signal from high intensity neighboring cells). Neurons are identified as having a median GFP intensity higher than a certain threshold, defined manually by referencing the raw images, and is fixed for all samples for the same experiment. D: Neurod:eGFP levels (left) correlate well with HuC:Kaede levels (right), in a 28hpf embryo. For randomly selected cells in the neural tube, we find that neurod status (defined manually as positive or negative) is similar to huc status (similarly defined). Specifically, most cells (28/30) are either neurod+/huc+ or neurod-/huc-. |