
|
Fig. S2
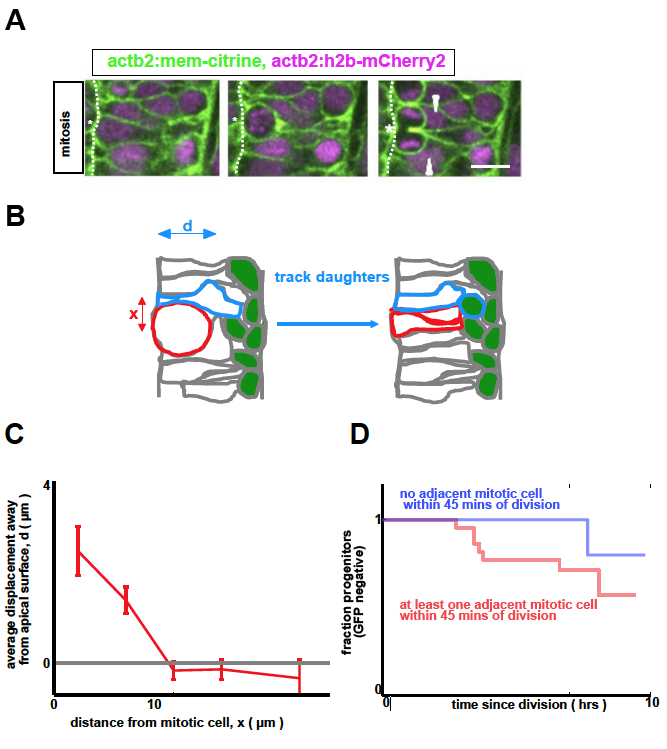
A: Endogenous mitotic cells physically deform their neighbors, depicted in a montage of images separated by 9 minutes per frame. Asterisk denotes mitotic cell ending cytokinesis; arrowheads denote perturbed adjacent cells. (Scale bar: 10μm)
B: Mitotic cells transiently push their neighbors away from the apical surface (schematic).
C: We measure the maximal basal displacement moved by a given cell as a result of a nearby division. We also record the distance x μm along the apical surface between the measured cell and the mitotic cell. We then group the data according to x, and plot the mean and standard error as shown.
D: By tracking progenitors, we see a small, but not significant (p = 0.1) difference in differentiation rate when comparing cells that are or are not adjacent to dividing cells within 45-60 minutes of their own division (n=58, same movies as in Figure 2).