
- Title
-
Effects of fin fold mesenchyme ablation on fin development in zebrafish
- Authors
- Lalonde, R.L., Akimenko, M.A.
- Source
- Full text @ PLoS One

Nitroreductase (NTR) in Tg(Inta11:NTR) is expressed in subset of hoxa13a/hoxd13a-expressing mesenchyme of pectoral fin fold and hoxa13a-only expressing mesenchyme of the median fin fold. (A-D) Whole mount view of transgenic lines using the “m-Inta11-β-globin” regulatory elements at 52hpf. (E-H) Pectoral fin dissections showing reporter, hoxa13a, hoxa13b, and hoxd13a expression in the fin fold mesenchyme at 72hpf. (I-L) Median fin dissections showing reporter, hoxa13a, hoxa13b, and hoxd13a expression in the fin fold mesenchyme at 60hpf. At 52hpf, transgene (eGFP, mCherry, YFP-NTR) expression is visible in the migrating mesenchyme of the median fin fold using the “m-Inta11-β-globin” regulatory elements (white arrow) (A-D). Double transgenic fish Tg(m-Inta11-β-globin:mCherry; m-Inta11-β-globin:YFP-NTR) show colocalization of mCherry and YFP expressing cells in the median fin fold (D). Reporter expression is present in the migrating mesenchyme within the pectoral fin fold, as well as cells located at the distal edge of the endoskeletal disc (red arrow) (E), recapitulating a subset of hoxa13a/hoxd13a-expressing cells (F). hoxa13b, and hoxd13a expression extends proximally within the endoskeletal disk and this region does not correlate with reporter expression (yellow arrows) (G, H). Dotted line represents limit between fin fold and endoskeletal disc (F-H). Reporter expression is present in the migrating mesenchyme within the median fin fold (red arrow) (I), recapitulating endogenous hoxa13a expression (J). No hoxa13b or hoxd13a expression is visible in the median fin at 60hpf (yellow arrows) (K, L). Brightfield (F-H, J-L), fluorescence (A-D), and brightfield/fluorescence merged images (E, I K). ED, Endoskeletal disc; FF, Fin fold. Scale bars: 200μm in A-D; 50μm in E-G, I-L; 30μm in H. |

Subset of hoxa13a/hoxd13a-expressing cells specifically ablated in Tg(Inta11:NTR)fish following metronidazole treatment. (A-C, E-I) Median fin fold of 72hpf larvae from 3 treatment groups (2 control, 1 experimental), YFP expression levels and TUNEL assay are shown. (D) Schematic of “Larval 1” treatment, larvae are exposed from 30-60hpf. Median fin morphology unaffected in treatment control groups (WT + MTZ, Inta11: NTR—MTZ) (A, B) compared to Inta11: NTR + MTZ (C). Inat11: NTR + MTZ larvae show median fin fold collapse (black arrow) (C). YFP expression drastically reduced in Inta11: NTR + MTZ larvae (red arrow) (F), when compared to Inta11: NTR—MTZ (green arrow) (E). A small percentage of treated control larvae (10% and 6.66%) display single TUNEL-positive cells in the median fin fold (white arrow) (G, H). All treated Inta11: NTR + MTZ larvae (n = 16) show TUNEL-positive cells in the median fin fold (white arrow) (I). Brightfield (A—C), fluorescence (E, F), and brightfield/fluorescence merged images (G-I). Scale bars: 100μm in A-C, E-I. |

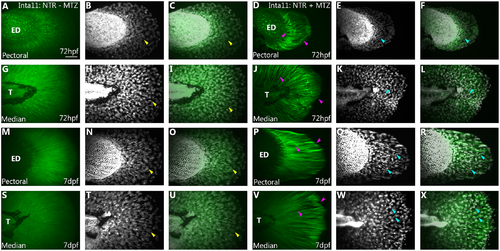
Morphological and migratory defects of the pectoral and median fin fold mesenchyme in Tg(Inta11:NTR) larvae following metronidazole treatment. (A-J) Pectoral and (M-W) median fin of 60, and 72hpf Inta11: NTR + MTZ and Inta11: NTR—MTZ larvae outcrossed with Tg(Inta11-β-globin:eGFP) transgenic larvae. At 60hpf, Inta11: NTR—MTZ show the beginning of fin fold migration in the pectoral fin (white arrow) (A-C). Migration is absent/delayed in the pectoral fin of the Inta11: NTR + MTZ group (yellow arrow) (D-F). At 72hpf, Inta11: NTR + MTZ larvae display reduced fin fold mesenchyme migration in the pectoral fin (J-L) compared to the control (G-I). Fin fold mesenchyme are less elongated/branched and are clustered close to the endoskeletal disk (red arrow) (J-L), compared to control pectoral fins (white arrow) (G-I). At 60, and 72hpf median fin fold mesenchyme of Inta11: NTR + MTZ larvae cluster next to the trunk, and are more round and less elongated/branched (red arrow) (P-R, V-X), compared to control larvae (white arrow) (M-O, S-U). Brightfield (A, D, G, J, M, P, S, V), fluorescence (B, E, H, K, N, Q, T, W), and brightfield/fluorescence merged images (C, F, I, L, O, R, U, X). ED, Endoskeletal disc; T, Trunk. Scale bars: 50μm in A-X. |
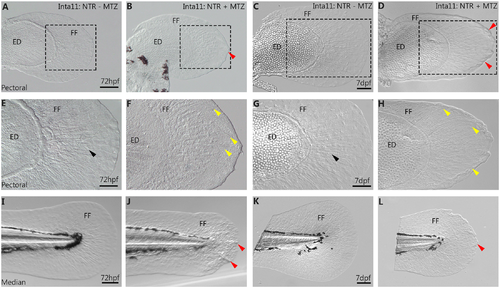
Fin fold collapse in 72hpf, 7dpf pectoral and median fins of Tg(Inta11:NTR) following metronidazole treatment. (A-H) Pectoral and (I-L) median fins of Inta11: NTR + MTZ and Inta11: NTR–MTZ control larvae at 72hpf and 7dpf. Inta11: NTR + MTZ larvae display pectoral fin fold collapse at 72hpf (B, F) and 7dpf (D, H), compared to Inta11: NTR—MTZ (A, C, E, G). Note the collapse of the fin fold (red arrows) (B, D). Panels E-H are magnifications of dotted box in panels A-D. Note the appearance of bending actinotrichia fibrils (yellow arrows) in Inta11: NTR + MTZ larvae (F, H) compared to straight actinotrichia (black arrows) in the Inta11: NTR—MTZ larvae (E, G). Inta11: NTR + MTZ larvae display major median fin fold defects at 72hpf (J) compared to Inta11: NTR—MTZ larvae (I). Note the collapse of the fin fold (red arrows) (J). By 7dpf, Inta11: NTR + MTZ larvae continue to show a reduction in median fin fold size compared to Inta11: NTR—MTZ larvae (K), however defects are ameliorated compared to Inta11: NTR + MTZ larvae at 72hpf (J, L). Note the minor folding of distal tip of the median fin (red arrow) (L). ED, Endoskeletal disc; FF, Fin fold. Scale bars: 100μm in A-D, F, H, I-L; 50μm in E, G. |
Actinotrichia defects in 72hpf, 7dpf pectoral and median fins of Tg(Inta11:NTR) following metronidazole treatment. Collagen II Immunostaining of (A-F, M-R) pectoral and (G-L, S-X) median fins of Inta11: NTR + MTZ and Inta11: NTR–MTZ control larvae at 72hpf and 7dpf. At 72hpf, and 7dpf untreated larvae show rigid, parallel actinotrichia throughout the pectoral and median fin fold (A, C, G, I, M, O, S, U), with DAPI staining revealing proper fin fold mesenchymal cell migration (Yellow arrow) (B, H, N, T). Note the fin fold mesenchyme elongate along the proximal distal axis, aligning with the actinotrichia (Yellow arrow) (B-C, H-I, N-O, T-U). At 72hpf, and 7dpf, actinotrichia of MTZ-treated larvae are unable to remain rigid and bend within the fin fold (Purple arrow) (D, F, J, L, O, R, V, X). This correlates with fin fold collapse. The actinotrichia are unable to remain parallel to one another, creating gaps within the fin fold (D, F, J, L, O, R, V, X). Note the apparent unbundling of Collagen II stained strands at 72hpf (Purple arrow) (D, J). At 72hpf, DAPI staining reveals fin fold mesenchyme cluster next to the pectoral fin endoskeletal disc and the trunk region proximal to the median fin fold (Teal arrow) (E, K), having failed to migrate correctly. At 7dpf, surviving fin fold mesenchyme fails to migrate correctly (Teal arrow) (Q, W). In the pectoral fin, migration is restricted to the central region of the fin fold (Teal arrow) (Q) and in both the pectoral and median fin, these cells display elongation along various different axes, correlating with actinotrichia defects (Teal arrow) (P-R, V-X). Collagen II staining (A, D, G, J, M, P, S, V), DAPI (B, E, H, K, N, Q, T, W) and merged (C, F, I, L, O, R, U, X) images are presented. ED, Endoskeletal disc, T, Trunk Scale bars: 50μm in A-X. |

Metronidazole-treated Tg(Inta11:NTR) larvae show defects in median fin fold mesenchyme migration, a reduction in median and pectoral fin fold size and a reduction in endoskeletal disc size. (A-B) Schematic of median fin fold measurements. (C-E, J) Graphs displaying measurements of median fin mesenchyme displacement (%), median fin fold width (mm) and height (mm), and pectoral fin fold and endoskeletal disc area (mm2). (F-G) Inta11: NTR—MTZ and (H-I) Inta11: NTR + MTZ pectoral fin at 7dpf outcrossed with Tg(kr19) to highlight endoskeletal disc. Fin fold mesenchyme cell displacement is represented as a percentage displaced relative to the overall fin fold length (trunk to distal tip) (Measurement 1), length of median fin fold is measured from trunk to distal tip (measurement 2), and height of median fin fold is measured from dorsal to ventral tips at the trunk (measurement 3) (A-B). Inta11: NTR + MTZ larvae display a reduction in median fin fold mesenchyme cell displacement at 48, 60, and 72hpf compared to control larvae (C). Inta11: NTR + MTZ larvae show a reduction in median fin fold width and height at 60, 72hpf, and 7dpf compared to control larvae (D, E). No difference is observed for either measurement at 48hpf (D, E). Inta11: NTR + MTZ larvae show a decrease in pectoral fin fold area at 72hpf, and 7dpf, as well as a reduction in endoskeletal disc size at 7dpf (J). Example of Inta11: NTR—MTZ (F, G) and Inta11: NTR + MTZ (H, I) pectoral fin used for distal fin fold, endoskeletal disc measurements. Region used for measurement is indicated by dotted line (F, G). Note the decreased disc size in the Inta11: NTR + MTZ pectoral fin (white asterisks) (I). Scapulocoracoid not included in the disc area measurements (yellow asterisks) (G, I). All bar values are an average of 10 measurements (n = 10 fins) with standard deviation indicated, with the exception of endoskeletal disc size (J). Endoskeletal disc values are based on measurements of 5, 5, and 8 fins (n = 5 fins, n = 5 fins, n = 8 fins) for treatment controls and Inta11: NTR + MTZ larvae respectively. Standard one-way ANOVA was performed. Each mean was compared against both other means. Tukey’s correction was applied. No statistically relevant difference was ever detected between treatment controls (WT + MTZ, Inta11: NTR—MTZ). Inta11: NTR + MTZ P-values (asterisks) are representative of comparisons with both treatment controls, with the exception of median fin fold width at 7dpf, where unique P-values are indicated for comparisons with each control (D). Brightfield (A-B, F, H), fluorescence (G, I). P-values: ** P = 0.001>0.005, **** P = <0.0001. ED, Endoskeletal disc; MFF, Median fin fold. Scale bars: 100μm (F-I). |

Altered gene expression profiles in the median and pectoral fin of Tg(Inta11:NTR) larvae following metronidazole treatment. (A-N) in situ hybridization and and1 reporter data showing gene expression profiles in the median and pectoral fin at 60, and 72hpf in Inta11: NTR—MTZ and Inta11: NTR—MTZ larvae. Inta11: NTR—MTZ are present in the left panels (A, C, E, G, I, K, M, O, Q) and Inta11: NTR + MTZ are present in the right panels (B, D, F, H, J, L, N, P, R). Inta11: NTR + MTZ show a decrease in distal hoxa13a expression (red arrow) in the median fin at 60hpf (B), and in the pectoral fin at 72hpf (D) compared to Inta11: NTR—MTZ (green arrow) (A, C). Note unaltered hoxa13a expression in the trunk region of Inta11: NTR + MTZ (red asterisks) (B). Inta11: NTR + MTZ show a decrease in distal hoxd13a expression (red arrow) in the pectoral fin at 72hpf (F) compared to Inta11: NTR—MTZ larvae (green arrow) (E). Note unaltered hoxd13a expression in the proximal disc region of Inta11: NTR + MTZ larvae (red asterisks) (F). Inta11: NTR + MTZ double transgenic larvae show decreased and1 reporter activity (red arrow) (J) in the pectoral fin compared to Inta11: NTR—MTZ double transgenic larvae (Red arrow) (I) at 72hpf. Brightfield (G-H) and fluorescent (I-J) images are included. Inta11: NTR + MTZ larvae show an increased anterior-posterior, and decreased proximal–distal expression domain of both shha and its receptor ptch2 in the pectoral fin at 72hpf (yellow arrows) (L, N) compared to Inta11: NTR—MTZ larvae (green arrow) (K, M). Inta11: NTR + MTZ show a decrease in distal/distal posterior fgf10a expression at 72hpf, in the median and pectoral fin respectively (red arrows) (P, R) compared to Inta11: NTR—MTZ larvae (green arrows) (O, Q). Note unaltered expression of fgf10a in the anterior pectoral fin mesenchyme of Inta11: NTR + MTZ larvae (red asterisks) (N). Dotted lines indicate fin fold and disk boundary (C-F, K-N, Q-R)). Probe or reporter line is indicated in the top right corner of each panel in the left column, age is indicated in the top right corner of each panel in the right column (A-R). Number of larvae displaying gene expression pattern, for in situ hybridization data, are indicated in the bottom right corner of each panel (A-F, K-R). WT-MTZ+DMSO images are contained in S1 Fig, and show similar expression profiles to Inta11: NTR—MTZ larvae (A, C, E, K, M, O, Q). ED, Endoskeletal disc; T, Trunk. Scale bars: 100μm in A, B, K, L; 50μm in I, J, M, N; 30μm in C-H. |

Actinotrichia defects, fin fold collapse, and fin ray defects in pectoral fins of Tg(Inta11:NTR) fish during late larval stages following metronidazole treatment. (A-L) Cartilage and bone stained pectoral fins of WT-MTZ+DMSO, Inta11:NTR—MTZ, and Inta11: NTR + MTZ larvae at three standard lengths (6.4, 6.8, and 7.2mm). At standard length 6.4mm, Inta11: NTR + MTZ larvae continue to show fin fold collapse (red arrow), and actinotrichia disorganization (C), compared to control larvae (A-B). Decomposition of disc cartilage matrix between presumptive proximal radials 2 and 3 has started (yellow asterisks) (A-C). Note, the initial stages of anterior-most lepidotrichia formation are not affected in the Inta11: NTR + MTZ larvae (C), compared to control larvae (A-B) (yellow arrows). At standard lengths 6.8mm and 7.2mm, Inta11: NTR + MTZ larvae have a reduced number of visible lepidotrichia compared to control larvae (D-I). Anterior-most and posterior-most visible rays have been numbered. Inta11: NTR + MTZ larvae continue to have minor collapse of the fin fold (red arrows) (F, I, L). Control larvae have clearly defined interray zones (black asterisks) and distal ray regions (black arrow) (D-E, G-H, J-K). Inta11: NTR + MTZ larvae have poorly defined interray zones (red asterisks) (F, I, L) similar to less developed rays in control larvae (red asterisks) (D-E, G-H) and the distal tips of the fin rays are nearly indiscriminate from the surrounding regions of the fin fold (F, I, L). Inta11: NTR + MTZ larvae show premature proximal fin ray calcification (purple asterisks) in the anterior rays (F, I, L) which is absent in control larvae (D-E, G-H, J-K). Estimate of fin ray length reduction highlighted with dotted line (J-L). As distal tip of fin rays are undefined in Inta11: NTR + MTZ, length measurements were not possible. Dotted lines span from proximal edge of fin ray to the distal edge of the fin fold at fin rays 2, and 3 (L). Identical length lines are then superimposed over control fin rays 2 and 3 (J, K) to show discrepancy in length. Disc matrix decomposition has started between presumptive proximal radials 1 and 2 (yellow asterisks) (D-F) at 6.8mm in length, and presumptive proximal radials 3 and 4 (yellow asterisks) at 7.2mm in length (G-I). All Inta11: NTR + MTZ larvae are 30dpf, and staged matched control larvae were selected based on three different staging criteria (standard length, spinal cord/rib calcification progress, and stages of endoskeletal disc cartilage matrix decomposition). Scale bars: 100μm in A-L. |
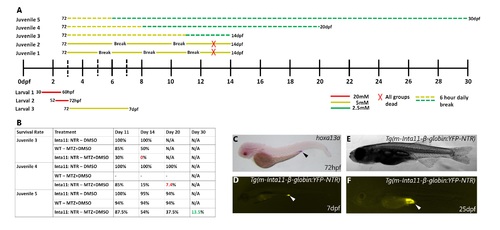
Schematic of larval and juvenile treatments, including survival rate of “juvenile 3–5” treatments. (A-B) All metronidazole treatments tested, including survival rates in “juvenile 3–5” treatments. (C) Secondary expression pattern of hoxa13a, YFP-NTR in digestive tract. “Larval 1–3” treatments used for all stats in Fig 6 (A). “Juvenile 1–2” treatments resulted in completely lethality at 13dpf of all treatment groups (A). “Juvenile 3–5” treatments included 6-hour daily breaks (A), however only “juvenile 5” treatment resulted in some Inta11: NTR + MTZ survival (13.5%) by 30dpf (B). WT + MTZ and Inta11: NTR—MTZ showed no difference in survival rate at 20dpf using “juvenile 5” treatment (B), and larvae were not raised to 30 dpf as they developed faster than Inta11: NTR + MTZ. Secondary expression pattern of NTR in digestive tract at 7dpf (white arrow) (D), consistent with hoxa13a expression during early larval development (black arrow) (C). Digestive tract YFP-NTR expression maintained throughout late larval development (25dpf) (white arrow) (E-F). Brightfield (C, E), fluorescence (D, F). |
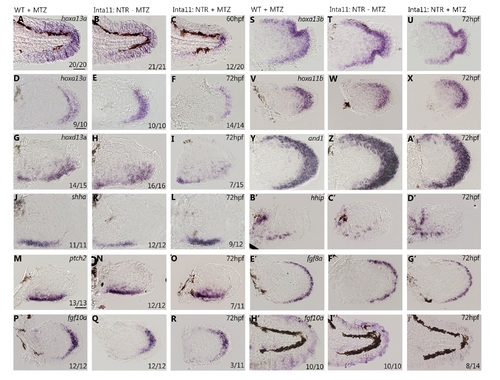
Altered gene expression profiles in the median and pectoral fin of Tg(Inta11:NTR) larvae following metronidazole treatment. (A-J’) Whole-mount in situ hybridization data showing altered, and unaltered gene expression profiles in the median and the pectoral fins of WT + MTZ, Inta11: NTR—MTZ, and Inta11: NTR + MTZ larvae. Inta11: NTR + MTZ larvae show altered gene expression patterns for hoxa13a, hoxd13a, shha, ptch2, and fgf10a as indicated in Fig 6 (A-R, H’-J’). WT—MTZ+DMSO larvae are included (A, D, G, J, M, P, H’). Inta11: NTR + MTZ show no difference in gene expression for hoxa13b, hoxa11b, and1, hhip, and fgf8a in the pectoral fin at 72hpf compared to control larvae (S-G’). Probe is indicated in the top right corner of each panel in the 1st, and 4th column (A, D, G, J, M, P, S, V, Y, B’, E’, H’), age is indicated in the top right corner of each panel in the 3rd, and 6th column (C, F, I, L, O, R, U, X, A’, D’, G’, J’). Number of larvae displaying gene expression pattern is indicated in the bottom right corner of each panel (A-R, H’-J’). Probes with no difference in gene expression do not have a value for number of larvae (C-G’), however each in situ hybridization experiment had 10–15 larvae per treatment group. Scale bars: 100μm in A-C, H’-J’; 50μm in M-R, V-X, B’-G’; 30μm in D-L, S-U, Y-A’. |

Absence of caudal fin defects in Tg(Inta11:NTR)larvae at 30dpf following metronidazole treatment, small percentage of larvae display major unrelated caudal fin defects in all treatment groups. Developmental delays in Tg(Inta11:NTR)larvae following metronidazole treatment. (A-C) Whole-mount view of larvae used for Fig 8G–8L. (D-F) Example of major caudal defects present in all treatment groups. (G-I) Comparison of larvae development between Inta11: NTR—MTZ and Inta11: NTR + MTZ. At 30 dpf, Inta11: NTR + MTZ larvae do not show caudal fin ray defects (black arrow) (A) compared to control larvae (black arrows) (B-C). Calcification of entire spinal cord and first 3–4 ribs (red arrow) used for stage matching between treatment groups. Standard length present in bottom right corner (A-C). Pectoral fins were dissected and imaged for Fig 8G–8L. All treatment groups (WT + MTZ, Inta11: NTR—MTZ, Inta11: NTR + MTZ) have a small percentage of larvae with major unrelated caudal fin defects (Yellow arrow) (D-F). Number of larvae with phenotype present in bottom right corner of each panel (D-F). Inta11: NTR + MTZ larvae show >5 day developmental delay at 20dpf (I). Inta11: NTR—MTZ larvae at 15dpf (G), and 20dpf (H) shown as comparison. Beginning of caudal fin ray formation detected in 15dpf Inta11: NTR—MTZ (G), and 20dpf Inta11: NTR + MTZ larvae (I) (Green arrow). All caudal fin rays present at 20dpf in Inta11: NTR—MTZ larvae (blue arrow) (H). Scale bars: 50μm in A-C, D-F, H; 30μm in G, I. |
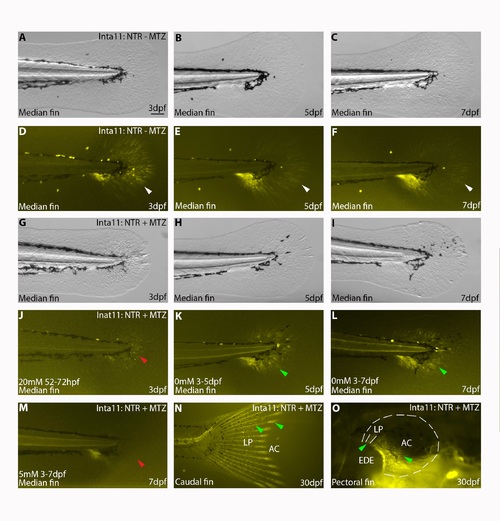
Fin fold mesenchyme regeneration in Tg(Inta11:NTR)larvae following metronidazole treatment, incomplete ablation YFP-expressing cells in caudal and pectoral fin of Tg(Inta11:NTR) larvae at 30dpf. (A-M) Comparison of YFP-NTR expression in the median fin from 3-7dpf in Inta11: NTR—MTZ, I Inta11: NTR + MTZ, where treatment is halted at 3dpf, and Inta11: NTR + MTZ where treatment is maintained until 7dpf. (N-O) Levels of YFP-NTR expression in Inta11: NTR + MTZ at 30dpf. Inta11: NTR—MTZ larvae show highest levels of YFP-NTR expression in the median fin fold at 3dpf (white arrow) (A, D). YFP-NTR expression levels decline by 5dpf (white arrow) (B, E) and 7dpf (white arrow) (C, F) in Inta11: NTR—MTZ larvae. Following ablation, YFP-NTR expression is nearly absent in Inta11: NTR + MTZ larvae at 3dpf (red arrow) (G, J). If left untreated, a new wave of YFP-NTR-expressing cells are initiated in the proximal fin regions surrounding the trunk by 5dpf (green arrow) (H, K), and continue distal migration at 7dpf (green arrow) (I, L). If treatment is maintained in Inta11: NTR + MTZ until 7dpf, we continue to ablate YFP-NTR expressing cells (red arrow) (M). Note panel M is representative of “larval 3” treatment (S1 Fig), “juvenile 5” treatment requires 6-hour daily breaks and modified concentrations for larvae survival (S4 Fig). By 30dpf, Inta11: NTR + MTZ show high levels of YFP-NTR expression in both the caudal (N) and pectoral fin (O) indicating fin fold mesenchymal is constantly being regenerated. In the caudal fin, YFP-NTR expressing cells are along the entire proximal-distal length of the lepidotrichia (green arrow) (LP) and concentrated at the distal tip where the actinotrichia (AC) are present (green arrow) (N). In the pectoral fin, YFP-NTR expressing cells are only present in the proximal portions of the lepidotrichia and actinotrichia (green arrows), immediately adjacent to the endoskeletal elements (O). Border of the pectoral fin is highlighted by dotted line (O). Brightfield (A-C, G-I), fluorescence (D-F, J-O). AC, actinotrichia; EDE, Endoskeletal Elements; LP, lepidotrichia. Scale bars: 100μm in A-M. |