
Fig. S2
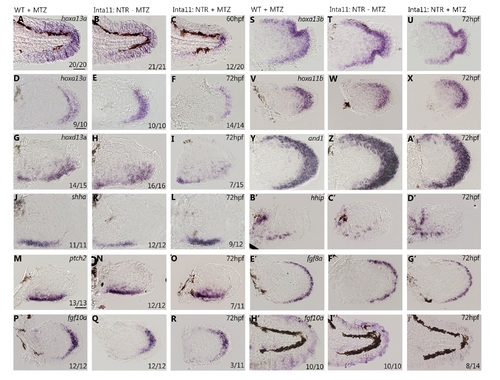
Altered gene expression profiles in the median and pectoral fin of Tg(Inta11:NTR) larvae following metronidazole treatment. (A-J’) Whole-mount in situ hybridization data showing altered, and unaltered gene expression profiles in the median and the pectoral fins of WT + MTZ, Inta11: NTR—MTZ, and Inta11: NTR + MTZ larvae. Inta11: NTR + MTZ larvae show altered gene expression patterns for hoxa13a, hoxd13a, shha, ptch2, and fgf10a as indicated in Fig 6 (A-R, H’-J’). WT—MTZ+DMSO larvae are included (A, D, G, J, M, P, H’). Inta11: NTR + MTZ show no difference in gene expression for hoxa13b, hoxa11b, and1, hhip, and fgf8a in the pectoral fin at 72hpf compared to control larvae (S-G’). Probe is indicated in the top right corner of each panel in the 1st, and 4th column (A, D, G, J, M, P, S, V, Y, B’, E’, H’), age is indicated in the top right corner of each panel in the 3rd, and 6th column (C, F, I, L, O, R, U, X, A’, D’, G’, J’). Number of larvae displaying gene expression pattern is indicated in the bottom right corner of each panel (A-R, H’-J’). Probes with no difference in gene expression do not have a value for number of larvae (C-G’), however each in situ hybridization experiment had 10–15 larvae per treatment group. Scale bars: 100μm in A-C, H’-J’; 50μm in M-R, V-X, B’-G’; 30μm in D-L, S-U, Y-A’. |