
Fig. S4
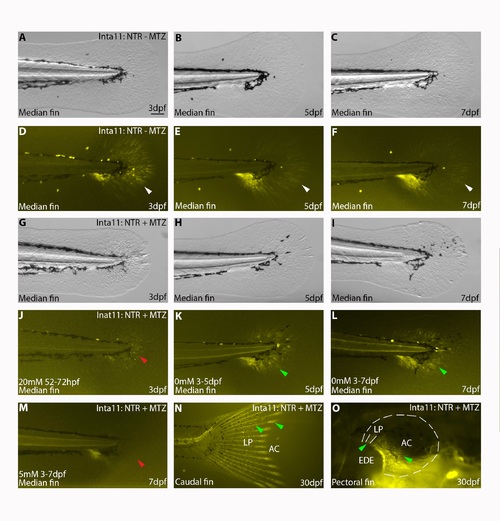
Fin fold mesenchyme regeneration in Tg(Inta11:NTR)larvae following metronidazole treatment, incomplete ablation YFP-expressing cells in caudal and pectoral fin of Tg(Inta11:NTR) larvae at 30dpf. (A-M) Comparison of YFP-NTR expression in the median fin from 3-7dpf in Inta11: NTR—MTZ, I Inta11: NTR + MTZ, where treatment is halted at 3dpf, and Inta11: NTR + MTZ where treatment is maintained until 7dpf. (N-O) Levels of YFP-NTR expression in Inta11: NTR + MTZ at 30dpf. Inta11: NTR—MTZ larvae show highest levels of YFP-NTR expression in the median fin fold at 3dpf (white arrow) (A, D). YFP-NTR expression levels decline by 5dpf (white arrow) (B, E) and 7dpf (white arrow) (C, F) in Inta11: NTR—MTZ larvae. Following ablation, YFP-NTR expression is nearly absent in Inta11: NTR + MTZ larvae at 3dpf (red arrow) (G, J). If left untreated, a new wave of YFP-NTR-expressing cells are initiated in the proximal fin regions surrounding the trunk by 5dpf (green arrow) (H, K), and continue distal migration at 7dpf (green arrow) (I, L). If treatment is maintained in Inta11: NTR + MTZ until 7dpf, we continue to ablate YFP-NTR expressing cells (red arrow) (M). Note panel M is representative of “larval 3” treatment (S1 Fig), “juvenile 5” treatment requires 6-hour daily breaks and modified concentrations for larvae survival (S4 Fig). By 30dpf, Inta11: NTR + MTZ show high levels of YFP-NTR expression in both the caudal (N) and pectoral fin (O) indicating fin fold mesenchymal is constantly being regenerated. In the caudal fin, YFP-NTR expressing cells are along the entire proximal-distal length of the lepidotrichia (green arrow) (LP) and concentrated at the distal tip where the actinotrichia (AC) are present (green arrow) (N). In the pectoral fin, YFP-NTR expressing cells are only present in the proximal portions of the lepidotrichia and actinotrichia (green arrows), immediately adjacent to the endoskeletal elements (O). Border of the pectoral fin is highlighted by dotted line (O). Brightfield (A-C, G-I), fluorescence (D-F, J-O). AC, actinotrichia; EDE, Endoskeletal Elements; LP, lepidotrichia. Scale bars: 100μm in A-M. |