
|
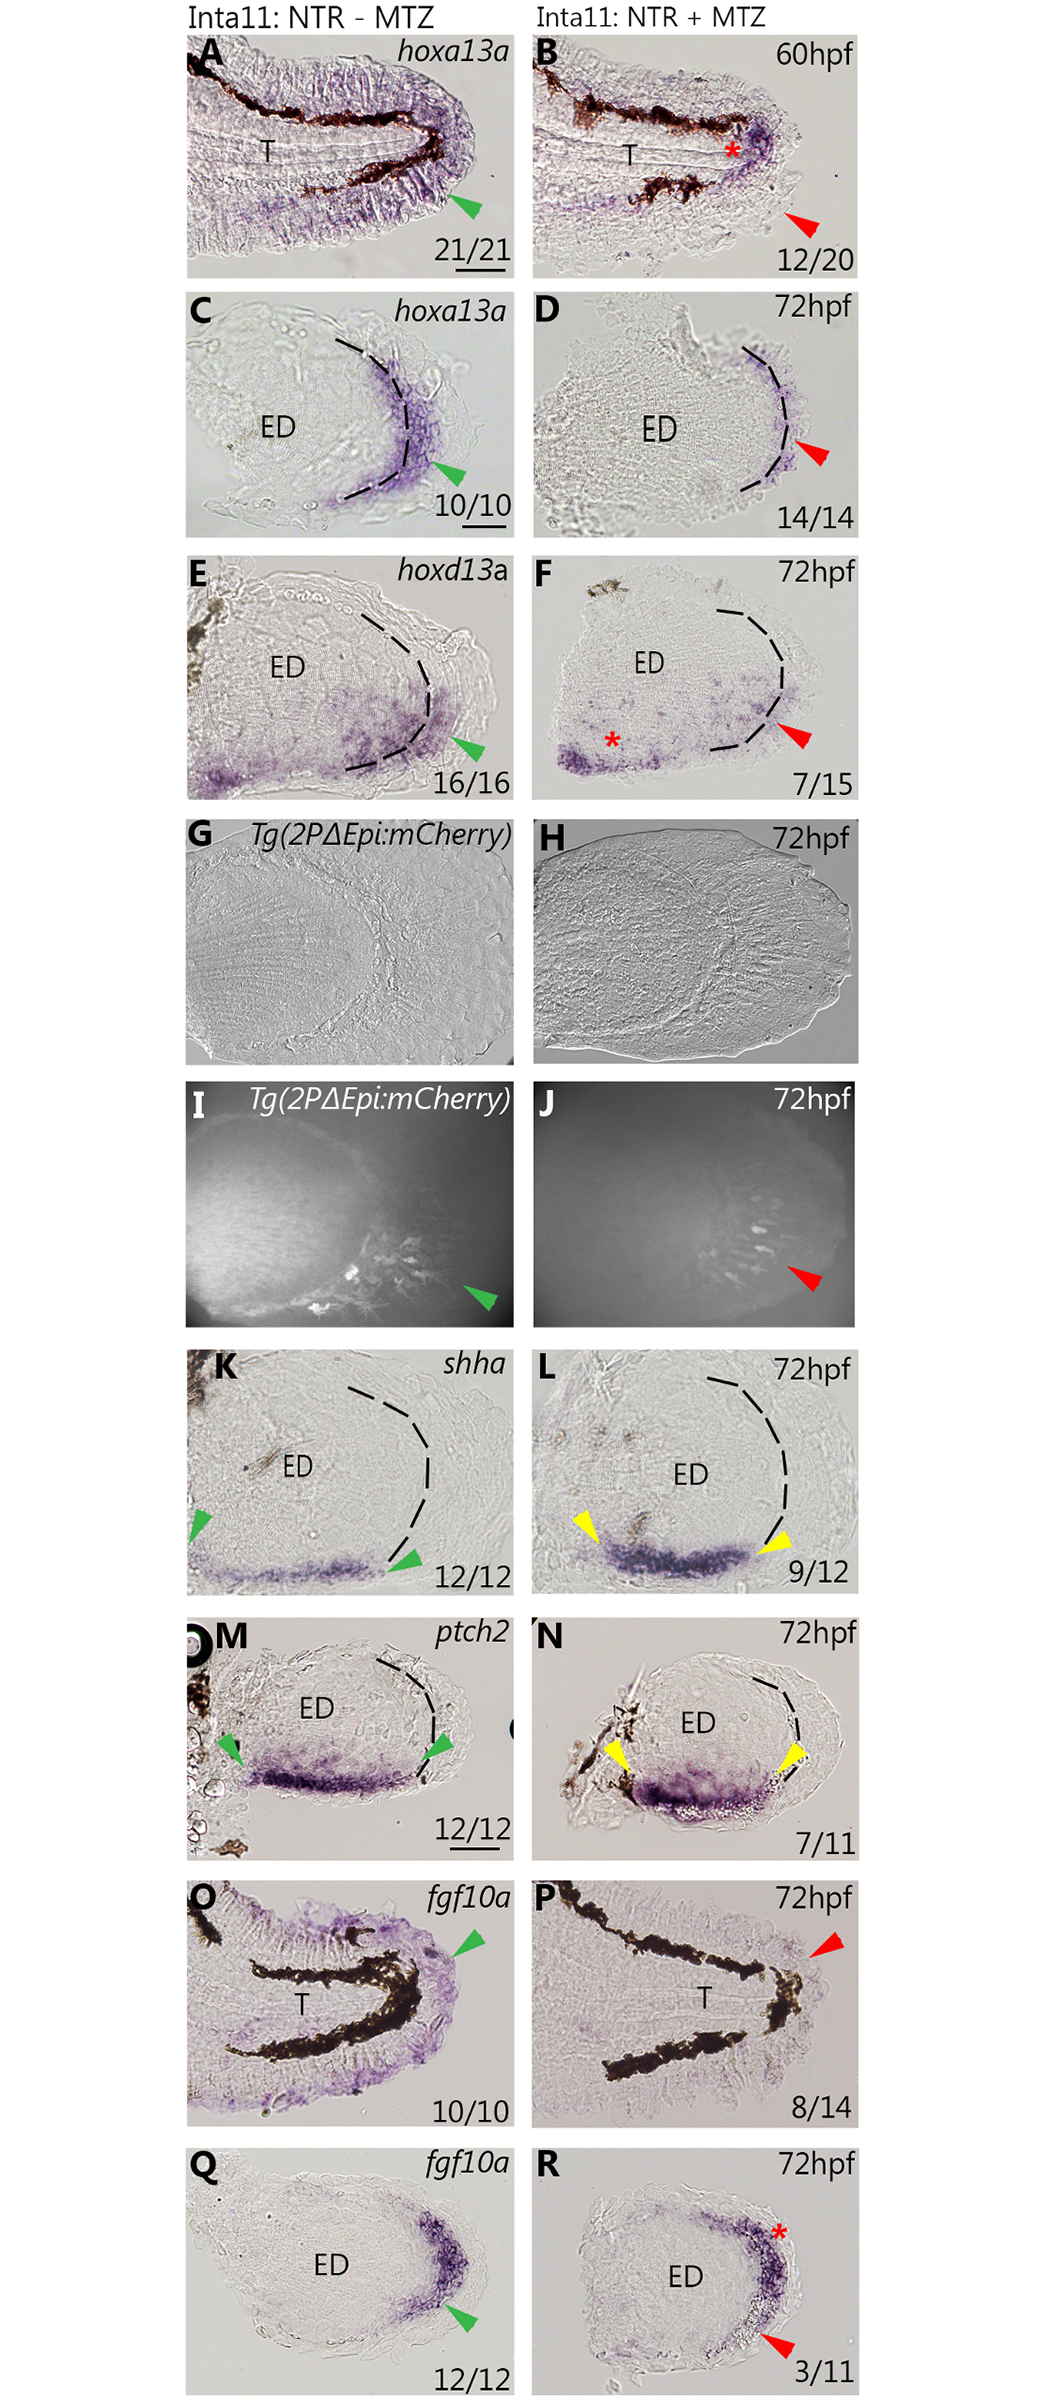
Fig. 7
Altered gene expression profiles in the median and pectoral fin of Tg(Inta11:NTR) larvae following metronidazole treatment.
(A-N) in situ hybridization and and1 reporter data showing gene expression profiles in the median and pectoral fin at 60, and 72hpf in Inta11: NTR—MTZ and Inta11: NTR—MTZ larvae. Inta11: NTR—MTZ are present in the left panels (A, C, E, G, I, K, M, O, Q) and Inta11: NTR + MTZ are present in the right panels (B, D, F, H, J, L, N, P, R). Inta11: NTR + MTZ show a decrease in distal hoxa13a expression (red arrow) in the median fin at 60hpf (B), and in the pectoral fin at 72hpf (D) compared to Inta11: NTR—MTZ (green arrow) (A, C). Note unaltered hoxa13a expression in the trunk region of Inta11: NTR + MTZ (red asterisks) (B). Inta11: NTR + MTZ show a decrease in distal hoxd13a expression (red arrow) in the pectoral fin at 72hpf (F) compared to Inta11: NTR—MTZ larvae (green arrow) (E). Note unaltered hoxd13a expression in the proximal disc region of Inta11: NTR + MTZ larvae (red asterisks) (F). Inta11: NTR + MTZ double transgenic larvae show decreased and1 reporter activity (red arrow) (J) in the pectoral fin compared to Inta11: NTR—MTZ double transgenic larvae (Red arrow) (I) at 72hpf. Brightfield (G-H) and fluorescent (I-J) images are included. Inta11: NTR + MTZ larvae show an increased anterior-posterior, and decreased proximal–distal expression domain of both shha and its receptor ptch2 in the pectoral fin at 72hpf (yellow arrows) (L, N) compared to Inta11: NTR—MTZ larvae (green arrow) (K, M). Inta11: NTR + MTZ show a decrease in distal/distal posterior fgf10a expression at 72hpf, in the median and pectoral fin respectively (red arrows) (P, R) compared to Inta11: NTR—MTZ larvae (green arrows) (O, Q). Note unaltered expression of fgf10a in the anterior pectoral fin mesenchyme of Inta11: NTR + MTZ larvae (red asterisks) (N). Dotted lines indicate fin fold and disk boundary (C-F, K-N, Q-R)). Probe or reporter line is indicated in the top right corner of each panel in the left column, age is indicated in the top right corner of each panel in the right column (A-R). Number of larvae displaying gene expression pattern, for in situ hybridization data, are indicated in the bottom right corner of each panel (A-F, K-R). WT-MTZ+DMSO images are contained in S1 Fig, and show similar expression profiles to Inta11: NTR—MTZ larvae (A, C, E, K, M, O, Q). ED, Endoskeletal disc; T, Trunk. Scale bars: 100μm in A, B, K, L; 50μm in I, J, M, N; 30μm in C-H.