
- Title
-
Structure and Function of an Actin-Based Filter in the Proximal Axon
- Authors
- Balasanyan, V., Watanabe, K., Dempsey, W.P., Lewis, T.L., Trinh, L.A., Arnold, D.B.
- Source
- Full text @ Cell Rep.

Actin Patches Are Found in the Proximal Axons of Live Neurons and Mark Positions Where Vesicles Carrying Dendritic Proteins Halt and Reverse (A) 15-DIV cortical neuron in dissociated culture expressing the actin label GFP-Utr (green) and mCherry (purple). The proximal axon is contained within the boxed area. Inset, lower left: ankyrin G labeling of the proximal axon (arrowhead). Right: upper panel shows magnified image of boxed area; lower panels show similar areas from other cortical neurons in culture expressing GFP-Utr under similar conditions (n = 20 neurons, 3 cultures). (B) Live 2-dpf zebrafish expressing GFP-Utr in motoneurons (n = 295 cells, 4 fish). (C and D) Higher magnifications of the area shown in the boxed regions of (B) and (C), respectively. In (D), arrowheads point to patches of actin in the proximal axon. (E) Proximal axon of a 3-DIV cortical neuron expressing GFP-Utr showing actin patches (arrowheads) (n = 15 neurons, 4 cultures). (F) 14-DIV cortical neuron in culture co-expressing TfR-mCherry and GFP-Utr (arrowheads point to the proximal axon). (G) Straightened image of a proximal axon showing GFP-Utr labeling of actin patches. (H) Kymograph of vesicles carrying TfR-mCherry (purple) and actin patches (green). White arrowheads indicate places where TfR-containing vesicles halted near actin patches; yellow arrowheads indicate places where halting took place away from patches. (I) Ankyrin G labeling of the axon initial segment of neuron in (F)–(H). Scale bars, 10 μm, unless otherwise indicated. See also Figures S1 and S2 and Movies S1 and S2. |

Actin Patches Are Dynamic (A) A series of time-lapse images of the proximal axon of a cortical neuron expressing GFP-Utr taken 30 min apart. (B) Merge of the images at t = 0 (purple) and t = 30 min (green). White puncta represent patches that have persisted, purple puncta represent patches that have disappeared or moved from that location, and green puncta represent patches that have appeared or moved to that location. (C) Images similar to those in (A) taken 1 min apart. (D) Merge of images from (C) at t = 0 (purple) and t = 1 min (green). (E) Merge of timelapse images of GFP-Utr at t = 0 (purple) and t = 1 to 9 min (green). (F) Graph of the number of patches that have persisted from t = 0 over time. Solid line corresponds to the fit of 2 exponentials, tau 1 = 0.7 ± 0.1 min; tau 2 = 6.5 ± 0.4 min; R2 = 0.9979. Roughly 40% of patches have kinetics corresponding to the shorter tau; the rest have kinetics corresponding to the longer tau. Results are a compilation of data from 3 neurons and 3 separate cultures. Scale bars, 5 μm. See also Figure S3 and Movies S3, S4, S5, and S6. |

caMyoVa, but Not caMyoVI, Is Excluded from the Axon In Vivo (A–F) Spinal motoneuron in 2-dpf zebrafish expressing (A) GFP, (B) caMyoVa-mCherry, (C) caMyoVa-mCherry (purple) and GFP (green) (n = 9 neurons, 3 fish), (D) GFP, (E) caMyoVI-mCherry, and (F) caMyoVI-mCherry (purple) and GFP (green) (n = 9 neurons, 3 fish). Scale bars, 10 μm. |
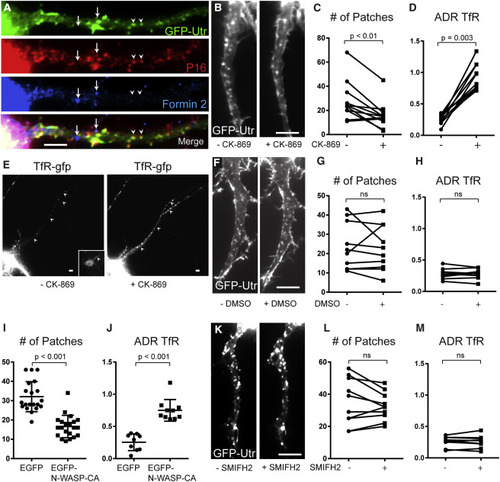
Actin Patches Are Dependent on ARP2/3 but Not on Formin 2 (A) 13-DIV cortical neuron expressing GFP-Utr and co-immunostained for P16 (red), Formin 2 (blue), and GFP (green) shows colocalization between actin patches and the ARP2/3 complex but not Formin 2. Arrows point to regions that express Formin 2, but not Utr-GFP or P16. Arrowheads point to regions that express Utr-GFP and P16, but not Formin 2. (B) Axon expressing GFP-Utr before and after exposure to CK-869 for 30 min. (C) Numbers of actin patches in the proximal axon before and after exposure to CK-869 for 30 min (n = 11 neurons, 4 cultures). (D) ADR (axon-to-dendrite ratio) showing the relative amount of TfR-GFP in the proximal axon before and after exposure to CK-869 (n = 11 neurons, 4 cultures). (E) Cortical neuron expressing TfR-GFP before and after exposure to CK-869. Inset shows ankyrin G staining. Arrowheads point to axon. (F) Proximal axon in cortical neuron expressing GFP-Utr before and after exposure to DMSO. (G) Number of actin patches in proximal axon before and after exposure to DMSO (n = 10 neurons, 5 cultures). ns, not significant. (H) ADR of TfR before and after exposure to DMSO (n = 10 neurons, 5 cultures). (I) Number of actin patches in proximal axon of neurons expressing EGFP (n = 20 neurons, 3 cultures) and neurons expressing EGFP-NWASP-CA (n = 21 neurons, 3 cultures). Neurons co-expressed TagRFP-Utr. (J) ADR of TfR in cortical neurons co-expressing either EGFP (n = 9 neurons 2 cultures) or EGFP-N-WASP-CA (10 neurons, 3 cultures). (K) Proximal axon in neuron expressing GFP-Utr before and after exposure to SMIFH2. (L) Number of actin patches in proximal axon before and after exposure to SMIFH2 (n = 10 neurons, 2 cultures). (M) ADR of TfR before and after exposure to SMIFH2 (n = 10 neurons, 2 cultures). Scale bars, 5 μm. See also Figure S5. |
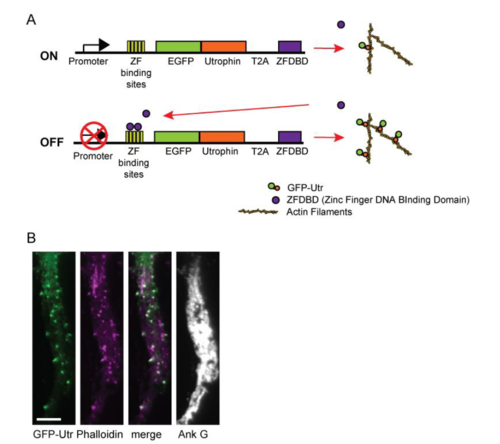
Regulated expression of Utrophin for labeling actin, related to Fig. 1. (A) Expression of Utrophin fused to GFP (GFP-Utr) and the CCR5 Zinc Finger DNA binding domain (ZFDBD) are driven by the CAG promoter. Just downstream of the transcriptional start site there are five DNA binding sites recognized by the CCR5 Zinc Finger (ZF binding site). Binding of the ZFDBD to the ZF binding site sterically hinders transcription of GFP-Utr limiting its expression. (B) Expression pattern of GFP-Utrophin in the proximal axon of a cortical neuron in culture (green) is highly similar to that of Phalloidin (purple), consistent with GFP-Utr faithfully labeling actin filaments. Ankyring G staining confirms that the process is an axon. Scale bar 5 μm. |
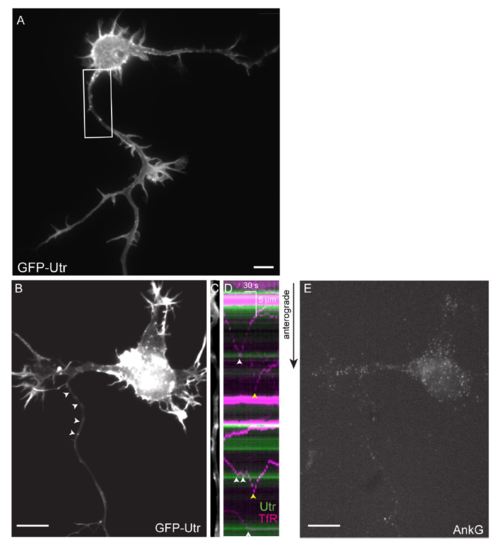
Vesicles carrying a dendritic protein tend to halt and reverse at sites near actin patches, related to Fig. 1. (A) Low magnification image of neuron whose proximal axon is shown in Fig. 1(E) (B) 3 DIV cortical neuron co-expressing GFP-Utr and TfR-mCherry (not shown). Arrowheads point to axon. (C) Straightened axon from neuron in (B). (D) Kymograph of neuron in (B, C) showing GFP-Utr (green) and TfR-mCherry (purple). White arrowheads indicate places where TfR containing vesicles halted near actin patches, yellow arrowheads indicate places where halting took place away from patches. (E) Ankyrin G staining of neuron in (B-D) showing a lack of Ankyrin G expression. Scale bar 10 μm. |
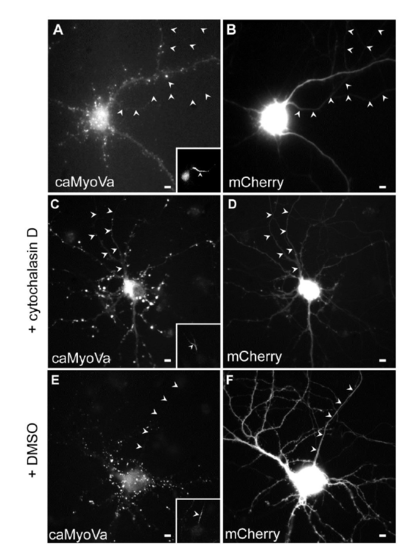
caMyoVa localization in the presence and absence of Cytochalasin D, related to Fig. 3. (A) Cortical neuron expressing caMyoVa, which is present mainly in the somatodendritic compartment in a diffuse manner (n = 10 neurons, 3 cultures). (B) Cortical neuron in (A) expressing mCherry. (C) Cortical neuron in culture expresses caMyoVa in the axon in the presence of Cytochalasin D. (n = 11 neurons, 3 cultures). (D) mCherry expressed in the same neuron as in (C). (E) caMyoVa is absent from the axon in the presence of DMSO. (n = 9 neurons, 3 cultures). (F) mCherry expressed in the same neuron as in (E). Insets show Ankyrin G staining. Arrowheads indicate axon. Scale bar 5 μm. |
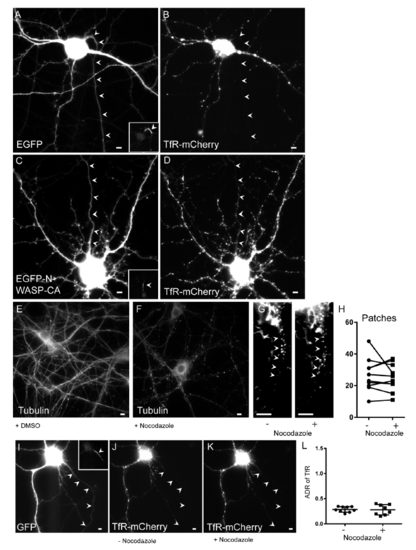
Effect of N-WASP-CA and Nocodazole on the number of actin patches and ADR of TfR, related to Figure 5. (A) Cortical neuron expressing EGFP and (B) TfR-mCherry, which is confined to the somatodendritic compartment. (C) Cortical neuron expressing EGFP-N-WASP-CA and (D) TfR-mCherry, which is present in the axon as well as in the somatodendritic compartment. (E) Image of a neuron in dissociated culture stained for tubulin after exposure to DMSO for 30 minutes shows intact microtubules. (F) Similar neuron to (E) exposed to Nocodazole for 30 minutes shows disruption of microtubules. (G, H) The number of patches labeled with GFP-Utr in the proximal axon of a neuron in dissociated culture in the absence and presence of Nocodazole (n = 9 neurons, 3 cultures). (I) Cortical neuron expressing GFP and (J) TfR-mCherry prior to addition of Nocodazole. (K) Same neuron as in (J) following 30 minutes of exposure to Nocodazole. (L) ADR of TfR is not statistically different in the presence (n = 10 neurons, 2 cultures) vs. absence (n = 9 neurons, 2 cultures) of Nocodazole. Inset shows Ankyrin G staining. Arrowheads point to axon. Scale bar 5 μm. |