
- Title
-
One crisis, diverse impacts-Tissue-specificity of folate deficiency-induced circulation defects in zebrafish larvae
- Authors
- Tu, H.C., Lee, G.H., Hsiao, T.H., Kao, T.T., Wang, T.Y., Tsai, J.N., Fu, T.F.
- Source
- Full text @ PLoS One
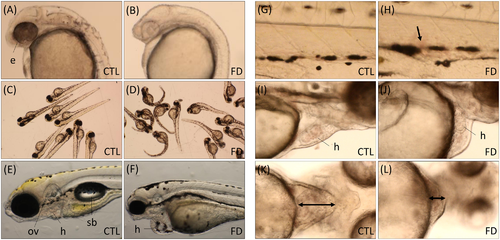
FD larvae displayed aberrant morphogenesis. FD larvae displayed morphological abnormalities in several tissues, including reduced pigmentation in both trunk and eyes (A, B), body curvature (C, D), shrunken eyes and otic vesicle, aberrant pericardial chamber and loss of swimbladder (E, F). Photos (A-F) and images (G-L; video stills of S1–S6 Videos) were taken when larvae reached 1 dpf (A, B), 3 dpf (C, D, I-L), 5 dpf (E, F) and 7 dpf (G, H). Ectopic accumulation of blood cells (arrow) (G, H) and pericardial chamber with altered dimensions (double-headed arrows) (K, L) were observed in FD larvae. CTL, heat-shocked non-fluorescent transgenic control; FD, folate deficiency; h, heart; e, eyes; sb, swim bladder; ov, otic vesicle. |
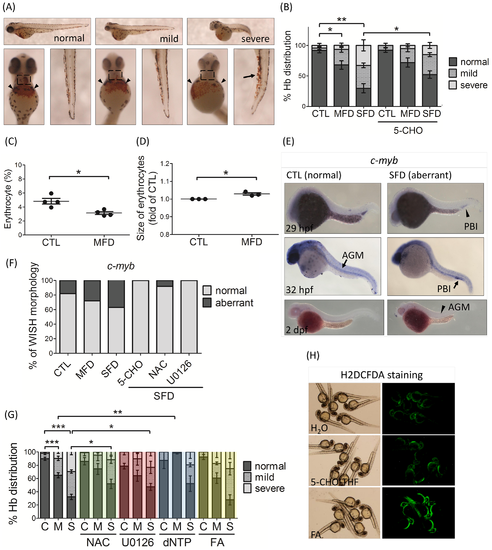
Zebrafish larval hematopoiesis and response to rescuing agents. (A, B) Hemoglobin of larvae in control and FD groups, with/without folate supplementation, were stained with o-dianisidine at 3 dpf. Hemoglobin signals were distributed most abundantly in the heart (dashed rectangles) and common cardinal veins (arrowheads) of control larvae (normal). Ectopic accumulation of hemoglobin in caudal veins (arrows) was often observed in FD larvae (mild and severe). The severity of anomalies was categorized and quantified based on the level and distribution of hemoglobin signals in larval heart and common cardinal veins. The images shown were the lateral (the upper panel) and ventral (the lower panel) views of larvae. Average of at least six independent experiments with the total sample number of 51–139 for each group are reported. (C, D) The relative number and size of embryonic erythrocytes were analyzed with flow cytometry for both control and FD embryos of 2-dpf generated by crossing Tg (hsp:EGFP-γGH) and Tg (gata1:dsRed). The numbers of erythrocytes were presented as the percentage of red fluorescent cells to total cell number. The size of erythrocytes was normalized with those of control larvae. Presented are data collected from at least three independent experiments with a total embryo number of approximately 30–40 for each group. (E) Hematopoiesis in both control and FD embryos was characterized by whole mount in situ hybridization with a riboprobe specific to c-myb, a hematopoietic stem cells marker. Reduced signals (arrowheads) with spatially and temporally altered distribution (arrows) were observed in embryos with severe folate deficiency. The larval responses to rescuing agents were quantified based on the distribution patterns of the c-myb signal at 32 hpf larvae (F) as shown in (E), and on the hemoglobin level (G) as shown in (A). There were approximately 10 to 40 larvae included for each group. (H) The 1-dpf wild-type larvae exposed to folic acid or 5-CHO-THF for 1 hour were examined for oxidative stress with H2DCFDA staining. C or CTL, heat-shocked non-fluorescent transgenic control; M or MFD, mild folate deficiency; S or SFD, severe folate deficiency; 5-CHO, 5-formyltetrahydrofolate; NAC, N-acetyl-L-cysteine; FA, folic acid. *, p<0.05; **, p<0.01; ***, p<0.001. PHENOTYPE:
|
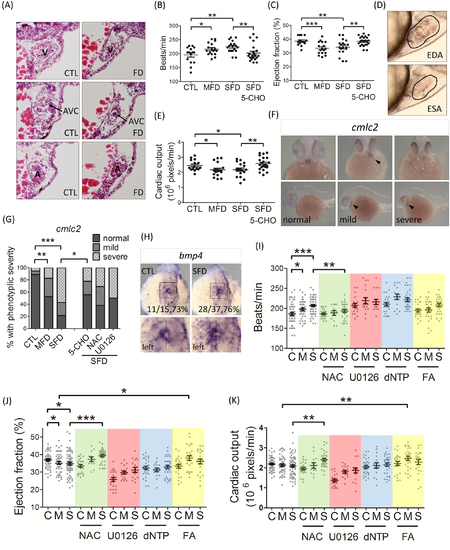
Zebrafish larval cardiogenesis and response to rescuing agents. (A) The serial cryo-sections of whole larvae at 3 dpf were HE-stained and examined for the integrity of heart chambers. (B-E) Larval heart beats were measured at 3 dpf. The cardiac ejection fraction and cardiac output were calculated from the dimension of cardiac chamber (D; circled area) in the video still images (lateral view with anterior to the right) as described in Materials and Methods. Data were collected from at least 3 independent experiments with the total sample number of 14–23 for each group. (F) The cardiac development in both control and FD larvae was characterized by WISH with the riboprobe specific to cmlc2, a cardiac primordium marker. Representative WISH images of cmlc2 showed decreased or spatially altered (arrowheads) signal in FD larvae at 2 dpf. Images were taken from ventral view (upper panel) and lateral view with the head to the left (lower panel). (G) The severity of cardiac developmental anomalies observed in embryos with/without rescuing agents supplementation were categorized into normal, mild and severe and quantified based on the distribution pattern and intensity of the cmlc2 WISH signal, as shown in (F). (H) The distribution of bmp4 transcripts in embryos at 21 hpf was characterized by WISH. Bmp4 expressed predominantly on the left side of embryonic cardiac disc in both control and FD embryos. Embryos were shown in dorsal view with head to the top and the boxed region magnified in inset at the lower panel. (I-K) The larval responses to rescuing agents were also evaluated based on cardiac function, including heart beats, cardiac ejection fraction and cardiac output on 3-dpf larvae exposed to the indicated compounds. Data were collected from at least 3 independent experiments with a total embryo number of 15–50 for each group. C or CTL, heat-shocked non-fluorescent transgenic control; FD, folate deficiency; M or MFD, mild folate deficiency; S or SFD, strong folate deficiency; A, atrium; AVC, atrium-ventricle canal; V, ventricle; EDA, end-diastolic area; ESA, end-systolic area; 5-CHO, 5-formyltetrahydrofolate; NAC, N-acetyl-L-cysteine; FA, folic acid. *, p<0.05; **, p<0.01; ***, p<0.001. EXPRESSION / LABELING:
PHENOTYPE:
|
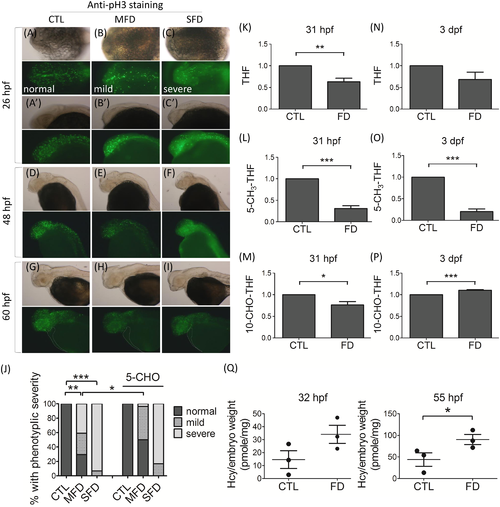
The impact of folate deficiency to embryonic cell proliferation and one-carbon pools. (A-I) Embryos at the indicated stages were subjected to whole mount immunological staining with anti-pH3 antibodies for proliferating cells in whole body and especially in the cardiac area (dashed line). The green fluorescent puncta represent the positive signal of pH3, which were distinctive and distinguishable from the homogeneous green fluorescent background raised from the heat-shock induced EGFP-γGH. Images were taken from dorsal view (A-C) and lateral view (A’-C’ and D-I) with anterior to the left. (J) Quantification of phenotypes (normal, mild, and severe) for embryonic cell proliferation in each group was based on the signal intensity detected at 26 hpf, as shown in (A-C). Data were collected from at least 3 independent experiments with the total sample number of 9–15 for each group. Larvae of 31 hpf (K-M) and 3 dpf (N-P) were subjected to intracellular folate content measurement with HPLC. (Q) Larvae of 32 hpf (left) and 55 hpf (right) were analyzed for homocysteine content. Data presented were the average of at least three independent trials and were normalized by embryo weights. CTL, heat-shocked wild-type control; MFD, mild folate deficiency; SFD, severe folate deficiency; FD, folate deficiency. 5-CHO, 5-formyltetrahydrofolate; THF, tetrahydrofolate; 10-CHO-THF, 10-formyltetrahydrofolate; 5-CH3-THF, 5-methyltetrahydrofolate. *, p<0.05; **, p<0.01; ***, p<0.001. PHENOTYPE:
|
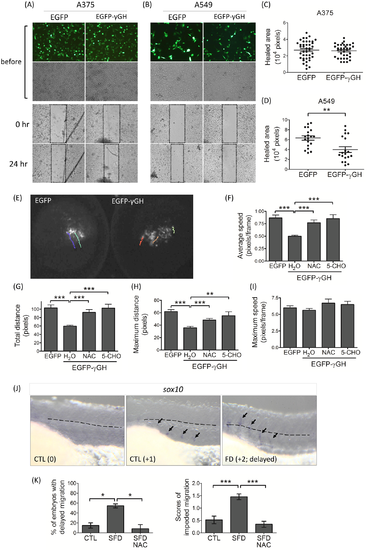
Folate deficiency impeded embryonic cells migration. The cultured A375 human melanoma cells (A) and A549 alveolar basal epithelial adenocarcinomic cells (B) were transfected with plasmids expressing either EGFP or EGFP-γGH fusion protein and subjected to the wound-healing assay. The wound was scratched and recorded for the scratched area immediately (0 hr) and again one day later (24 hr). The migration of A375 (C) and A549 (D) cells was evaluated by the “healed area”, which was calculated as described in Materials and Methods. Presented are the data collected from approximately 20 different wound areas from at least 3 to 6 independent repeats. (E) Wild-type zebrafish embryos at 64-cell stage were injected with the plasmids expressing either EGFP or EGFP-γGH into one single cell and continuously recorded for the migration of injected cells following the green fluorescence. Each colored line represents a single cell migratory track in one-hour recording period. The migratory parameters of recorded cells, including average speed (F), total distance (G), maximum distance (H) and maximum speed (I), were calculated with the on-line software CellTracker (v1.0, F. Piccinini et al., 2015) on MATLAB R2015a system. Zebrafish larvae of 31 hpf were subjected to WISH with the riboprobe specific to sox10 to track the migration of neural crest cells. (J, K) The extent of neural crest cells (arrows) migration in FD embryos with/without NAC exposure was graded and quantified based on the following criteria: completely evacuated from the neural crest (0), still visible and below (+1) or above (+2, delayed) the trunk mid-line (dotted line). CTL, heat-shocked non-fluorescent transgenic control; FD, folate deficiency; NAC, N-acetyl-L-cysteine; 5-CHO, 5-formyltetrahydrfolate. *, p<0.05; **, p<0.01; ***, p<0.001. |
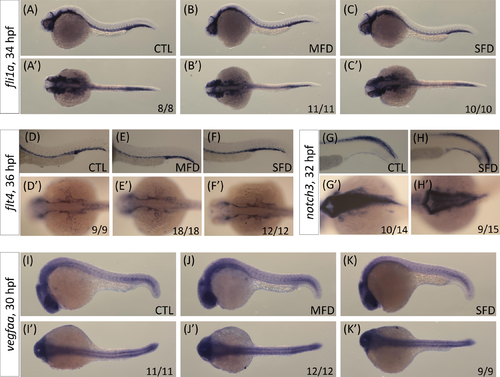
Embryos of both control and folate deficiency at indicated stages were subjected to WISH with the riboprobes fli1a for vessels (A-C), flt4 for vein (D-F), and notch3 (G, H) and vegfaa for artery (I-K). Larvae were shown with anterior to the left in lateral view (A-K; upper panel) and dorsal view (A’-K’; lower panel). The numerator and denominator at the lower right-hand corner indicate the number of larvae exhibiting the displayed phenotype and the total larvae in the group, respectively. CTL, heat-shocked non-fluorescent transgenic control; MFD, mild folate deficiency; SFD, severe folate deficiency. |