
Fig. 6
- ID
- ZDB-FIG-180417-53
- Publication
- Tu et al., 2017 - One crisis, diverse impacts-Tissue-specificity of folate deficiency-induced circulation defects in zebrafish larvae
- Other Figures
- All Figure Page
- Back to All Figure Page
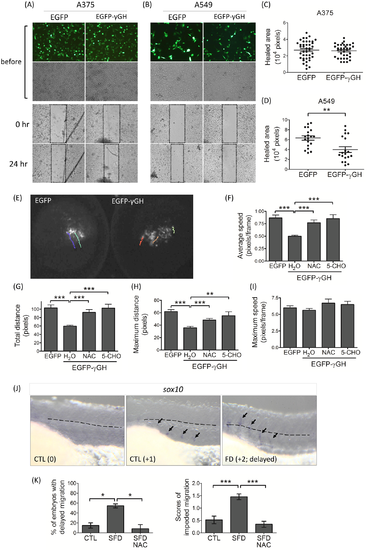
Folate deficiency impeded embryonic cells migration. The cultured A375 human melanoma cells (A) and A549 alveolar basal epithelial adenocarcinomic cells (B) were transfected with plasmids expressing either EGFP or EGFP-γGH fusion protein and subjected to the wound-healing assay. The wound was scratched and recorded for the scratched area immediately (0 hr) and again one day later (24 hr). The migration of A375 (C) and A549 (D) cells was evaluated by the “healed area”, which was calculated as described in Materials and Methods. Presented are the data collected from approximately 20 different wound areas from at least 3 to 6 independent repeats. (E) Wild-type zebrafish embryos at 64-cell stage were injected with the plasmids expressing either EGFP or EGFP-γGH into one single cell and continuously recorded for the migration of injected cells following the green fluorescence. Each colored line represents a single cell migratory track in one-hour recording period. The migratory parameters of recorded cells, including average speed (F), total distance (G), maximum distance (H) and maximum speed (I), were calculated with the on-line software CellTracker (v1.0, F. Piccinini et al., 2015) on MATLAB R2015a system. Zebrafish larvae of 31 hpf were subjected to WISH with the riboprobe specific to sox10 to track the migration of neural crest cells. (J, K) The extent of neural crest cells (arrows) migration in FD embryos with/without NAC exposure was graded and quantified based on the following criteria: completely evacuated from the neural crest (0), still visible and below (+1) or above (+2, delayed) the trunk mid-line (dotted line). CTL, heat-shocked non-fluorescent transgenic control; FD, folate deficiency; NAC, N-acetyl-L-cysteine; 5-CHO, 5-formyltetrahydrfolate. *, p<0.05; **, p<0.01; ***, p<0.001. |
| Gene: | |
|---|---|
| Fish: | |
| Condition: | |
| Anatomical Term: | |
| Stage: | Prim-15 |
| Fish: | |
|---|---|
| Conditions: | |
| Observed In: | |
| Stage: | Prim-15 |