
- Title
-
High Resolution Imaging of DNA Methylation Dynamics using a Zebrafish Reporter
- Authors
- Zhang, R., Liu, L., Yao, Y., Fei, F., Wang, F., Yang, Q., Gui, Y., Wang, X.
- Source
- Full text @ Sci. Rep.
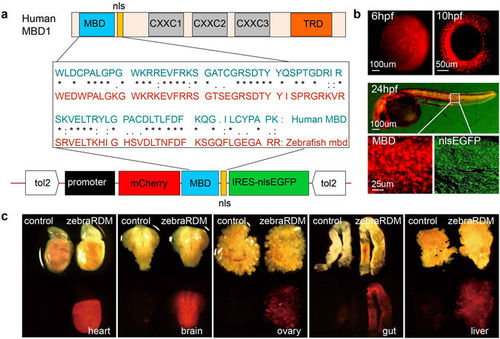
Generation of a zebrafish reporter ubiquitously expressing mCherry-MBD. (a) The structure of human MBD1, a comparison of the amino acid sequences of human and zebrafish methyl-binding domains, and the Tol2-based vector structure including promoter, the mCherry-MBD probe, and IRES-nlsEGFP. MBD, methyl binding domain; nls, nuclear localization signal; CXXC, cysteine-rich domains; TRD, transcriptional repression domain. (b) Fluorescence images of Tg(bactin2:mCherry-MBD-IRES-nlsEGFP) F1 embryos at 6, 10, and 24 hpf. Magnified images in white boxes display the mCherry-MBD channel (left) and IRES-nlsEGFP channel (right). (c) The distribution of mCherry-MBD in the adult zebrafish heart, brain, liver, ovary, and gut. The reporter is labeled as zebraRDM. |
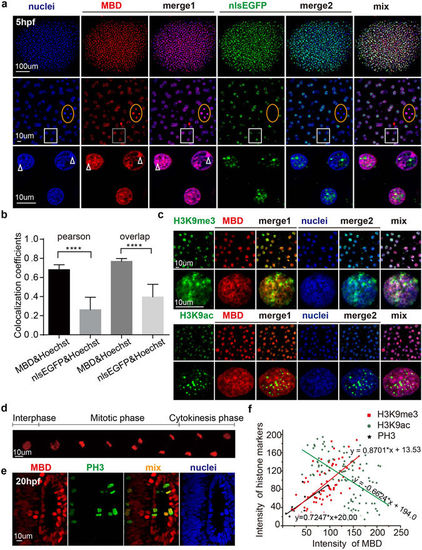
Colocalization of mCherry-MBD with heterochromatin and modified histones. (a) The correlation between Hoechst staining and the distribution patterns of the probes in 5 hpf embryos. Higher magnification images are arranged below. The orange boxes denote cells in mitotic metaphase; note that the nlsEGFP signal has disappeared due to nuclear envelope breakdown. White boxes below show magnified images. White arrowheads label puncta in Hoechst-stained nuclei. (b) Columns represent the overlap and Pearson coefficients for colocalization between Hoechst and the probes. P values < 0.0001, N = 27. (c) The colocalization pattern of mCherry-MBD and H3K9me3/ac. Lower rows showed subcelluar structure in one single cell nuclei. (d) Time lapse imaging of mCherry-MBD dynamics during the cell cycle. (e) The distribution of mCherry-MBD in phospho-Histone H3-positive metaphase cells. (f) The linear regression analysis between the intensity of MBD and that of modified histones. The plots represent cells or ROIs (region of interest) selected by image j (H3K9me3, N = 66 ROIs; H3K9ac, N = 112 ROIs; PH3, N = 10 cells). The intensity value ranged from 0 to 255. P value < 0.0001. |
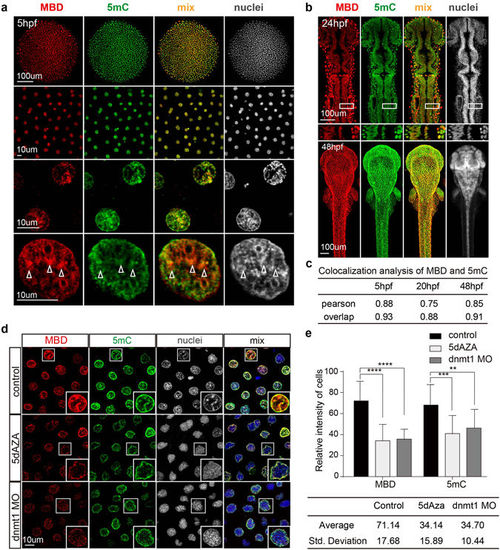
Comparison of the mCherry-MBD and 5 mC distribution patterns. (a) The distribution patterns of mCherry-MBD and anti-5 mC staining at 5 hpf. Higher magnification images are arranged below. White arrowheads label compacted puncta of chromatin. (b) The distribution patterns of mCherry-MBD and 5 mC at 24 hpf and 48 hpf. White boxes below are magnified 24 hpf images. (c) Colocalization analysis between mCherry-MBD, 5 mC, and heterochromatin (N = 12). (d) Comparison of nuclei from control embryos, and embryos treated by 5-dAZA or injected with dnmt1 MO. White boxes at right bottom are magnifications of each enclosed cell. (e) Fluorescence intensity of cells in each group (N = 16). The intensity value ranged from 0 to 255. P < 0.05. The intensity spectrums represented by the standard deviation are listed below. |
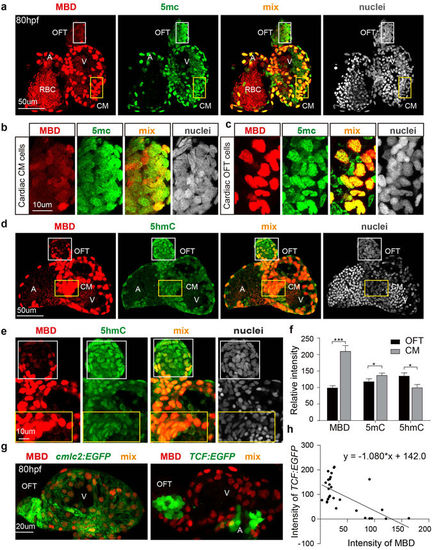
DNA methylation and hydroxymethylation patterns in the developing heart. (a) The distribution patterns for mCherry-MBD and 5 mC in the 80 hpf heart. (b,c) Magnified images of cardiac outflow tract cells (white boxes) and cardiac muscle cells (orange boxes) in A. A, atrium; V, ventricle; OFT, out flow tract; CM, cardiac muscle. (d) Comparison of mCherry-MBD and 5 hmC in the 80 hpf heart. (e) Magnified images of cardiac outflow tract cells (white boxes) and cardiac muscle cells (orange boxes) in D. (f) Fluorescence intensities of each group in the OFT and CM (p = 0.0105; N = 3) (g) The positional relationship of Wnt-responsive cells and mCherry-MBD expressing cells in 80 hpf heart. Left, cardiac muscle cells marked by cmlc2:EGFP; right, Wnt-responsive cells marked by TCF:EGFP. (h) Linear regression of TCF and MBD signaling intensity (P value < 0.0001, N = 30). |
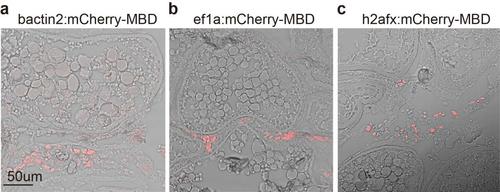
The distribution of the probe mCherry-MBD in F0 mosaic’s ovaries. (a-c) The distribution of the probe mCherry-MBD in the ovaries’ section of adult Tg(bactin2:mCherry-MBD-IRES-nlsEGFP), Tg(ef1a:mCherry-MBD-IRES-nlsEGFP), and Tg(h2afx:mCherry-MBD-IRES-nlsEGFP) respectively. |
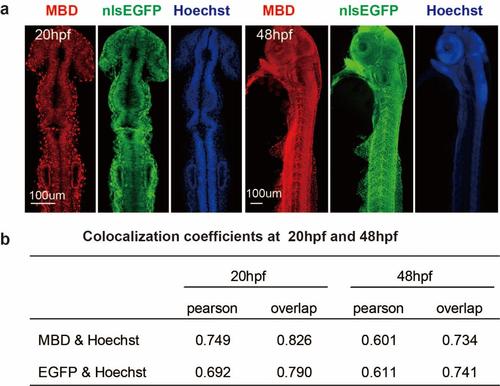
The distribution pattern of the probes mCherry-MBD and nlsEGFP at 20hpf and 48hpf. (a) The distribution pattern of the probe mCherry-MBD and the probe nlsEGFP in embryos at 20hpf and 48hpf. (b) The pearson’s correlation and overlap coefficient of chromosome and mCherry-MBD. |
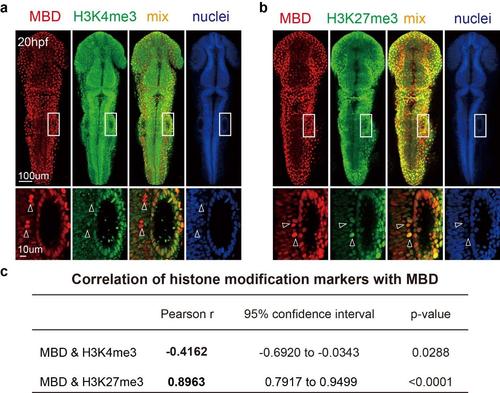
The correlation of tri-methylated H3K4/H3K27 with mCherry-MBD at 20hpf. (a) The correlation between mCherry-MBD and H3K4me3 at 20hpf. The images in white boxes are magnified below. White arrowheads denote overlapping cells. (b) The correlation between mCherry-MBD and H3K27me3 at 20hpf. (c) The pearson’s correlation and overlap coefficient of trimethylated H3K4/H3K27 and mCherry-MBD in general view. |