
Fig. 5
- ID
- ZDB-FIG-180118-4
- Publication
- Zhang et al., 2017 - High Resolution Imaging of DNA Methylation Dynamics using a Zebrafish Reporter
- Other Figures
- All Figure Page
- Back to All Figure Page
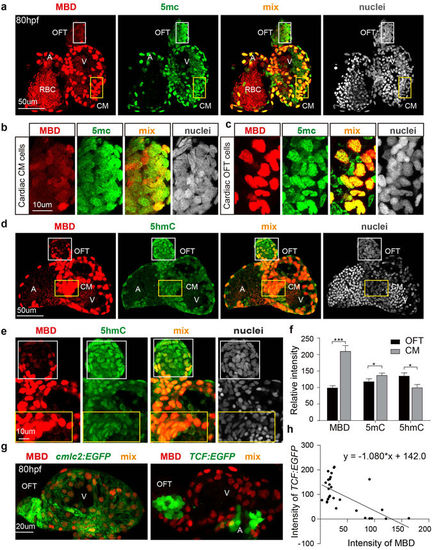
DNA methylation and hydroxymethylation patterns in the developing heart. (a) The distribution patterns for mCherry-MBD and 5 mC in the 80 hpf heart. (b,c) Magnified images of cardiac outflow tract cells (white boxes) and cardiac muscle cells (orange boxes) in A. A, atrium; V, ventricle; OFT, out flow tract; CM, cardiac muscle. (d) Comparison of mCherry-MBD and 5 hmC in the 80 hpf heart. (e) Magnified images of cardiac outflow tract cells (white boxes) and cardiac muscle cells (orange boxes) in D. (f) Fluorescence intensities of each group in the OFT and CM (p = 0.0105; N = 3) (g) The positional relationship of Wnt-responsive cells and mCherry-MBD expressing cells in 80 hpf heart. Left, cardiac muscle cells marked by cmlc2:EGFP; right, Wnt-responsive cells marked by TCF:EGFP. (h) Linear regression of TCF and MBD signaling intensity (P value < 0.0001, N = 30). |