
Fig. 3
- ID
- ZDB-FIG-180118-3
- Publication
- Zhang et al., 2017 - High Resolution Imaging of DNA Methylation Dynamics using a Zebrafish Reporter
- Other Figures
- All Figure Page
- Back to All Figure Page
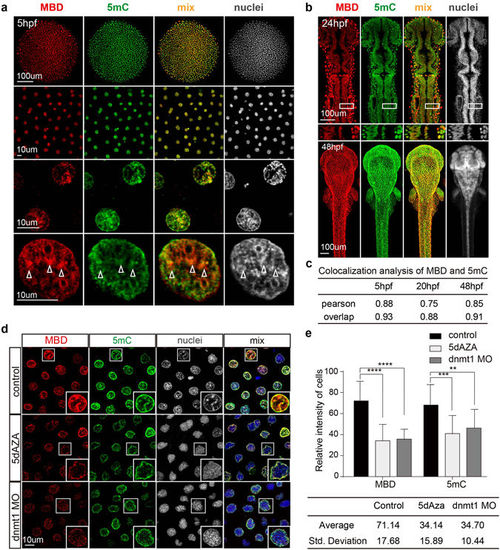
Comparison of the mCherry-MBD and 5 mC distribution patterns. (a) The distribution patterns of mCherry-MBD and anti-5 mC staining at 5 hpf. Higher magnification images are arranged below. White arrowheads label compacted puncta of chromatin. (b) The distribution patterns of mCherry-MBD and 5 mC at 24 hpf and 48 hpf. White boxes below are magnified 24 hpf images. (c) Colocalization analysis between mCherry-MBD, 5 mC, and heterochromatin (N = 12). (d) Comparison of nuclei from control embryos, and embryos treated by 5-dAZA or injected with dnmt1 MO. White boxes at right bottom are magnifications of each enclosed cell. (e) Fluorescence intensity of cells in each group (N = 16). The intensity value ranged from 0 to 255. P < 0.05. The intensity spectrums represented by the standard deviation are listed below. |