
|
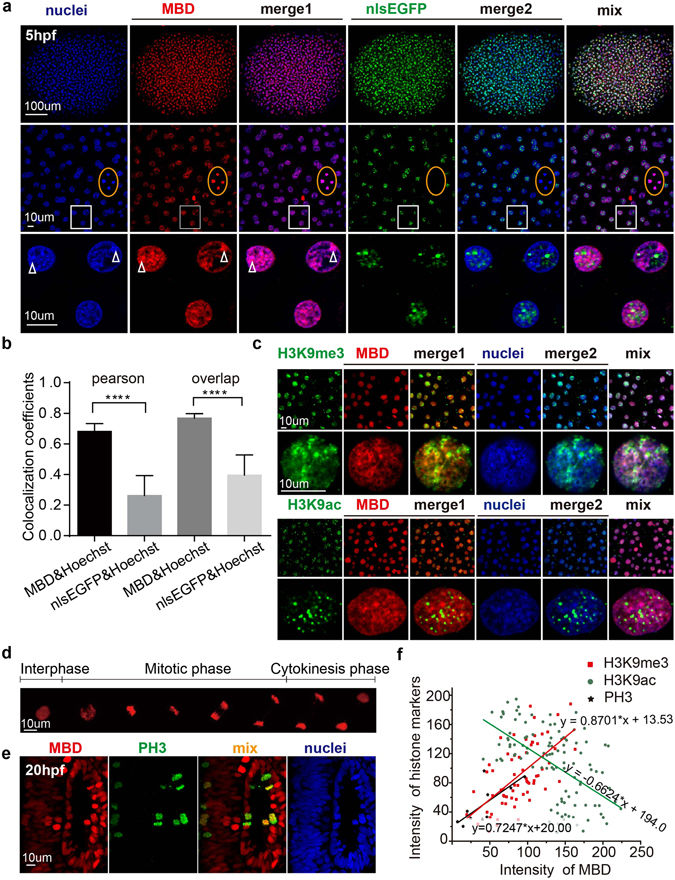
Fig. 2
Colocalization of mCherry-MBD with heterochromatin and modified histones. (a) The correlation between Hoechst staining and the distribution patterns of the probes in 5 hpf embryos. Higher magnification images are arranged below. The orange boxes denote cells in mitotic metaphase; note that the nlsEGFP signal has disappeared due to nuclear envelope breakdown. White boxes below show magnified images. White arrowheads label puncta in Hoechst-stained nuclei. (b) Columns represent the overlap and Pearson coefficients for colocalization between Hoechst and the probes. P values < 0.0001, N = 27. (c) The colocalization pattern of mCherry-MBD and H3K9me3/ac. Lower rows showed subcelluar structure in one single cell nuclei. (d) Time lapse imaging of mCherry-MBD dynamics during the cell cycle. (e) The distribution of mCherry-MBD in phospho-Histone H3-positive metaphase cells. (f) The linear regression analysis between the intensity of MBD and that of modified histones. The plots represent cells or ROIs (region of interest) selected by image j (H3K9me3, N = 66 ROIs; H3K9ac, N = 112 ROIs; PH3, N = 10 cells). The intensity value ranged from 0 to 255. P value < 0.0001.