
- Title
-
Zebrafish slc30a10 deficiency revealed a novel compensatory mechanism of Atp2c1 in maintaining manganese homeostasis
- Authors
- Xia, Z., Wei, J., Li, Y., Wang, J., Li, W., Wang, K., Hong, X., Zhao, L., Chen, C., Min, J., Wang, F.
- Source
- Full text @ PLoS Genet.
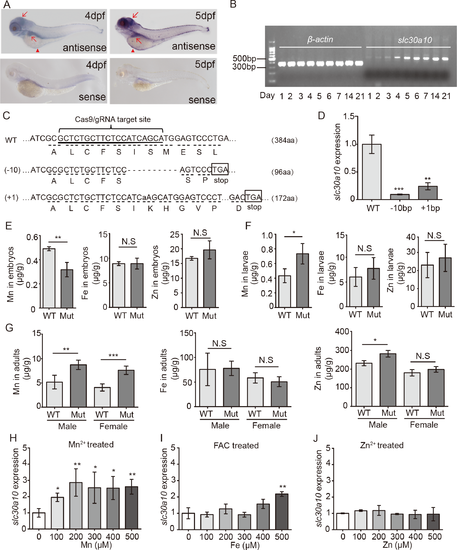
Slc30a10 functions as a Mn exporter in zebrafish. (A) In situ hybridization of wild-type zebrafish using the antisense slc30a10 probe, showing expression in the brain and liver (red arrows), as well as the YSL (red arrowheads). A sense probe was used as a negative control. (B) Semi-quantitative RT-PCR of slc30a10 mRNA in wild-type 1–7 dpf embryos, 14 dpf larvae, and 21 dpf larvae, showing the onset of expression at 5 dpf. (C) DNA and corresponding amino acid sequences of the wild-type (WT), 10-bp deletion (-10), and 1-bp insertion (+1) slc30a10 alleles following CRISPR/Cas9-based editing. (D) Summary of slc30a10 expression in WT and both slc30a10 mutant lines (n = 3 sets of 50 embryos/group). (E-G) Mn, Fe, and Zn concentration was measured in wild-type and mutant 1-week-old embryos (E; n = 6 sets of 1000 embryos/group), 3-week-old larvae (F; n = 3 sets of 50 larvae/group), and 4-month-old adults (G; n = 3 adults/group). (H-J) Heterozygous embryos were exposed to the indicated concentrations of Mn2+ (H), Fe3+ (ferric ammonium citrate, FAC; I), or Zn2+ (J) for 24 hours at 5 dpf. At 6 dpf, slc30a10 expression was measured; n = 3 sets of embryos/group. *p<0.05, **p<0.01, and ***p<0.001; N.S., not significant (p>0.05). |
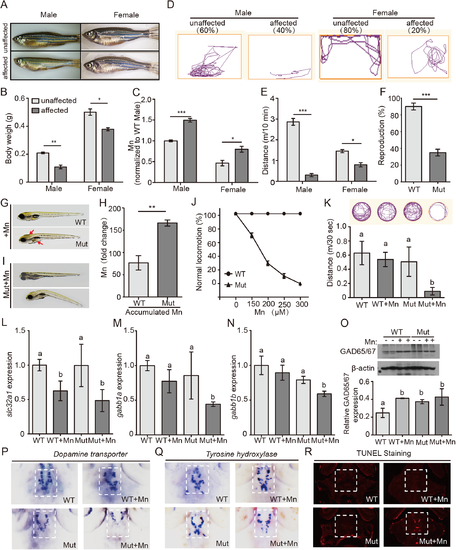
Slc30a10 mutants develop impaired neurological function. (A) Example images of affected mutant adults and their unaffected siblings; note the thinner body shape of the affected siblings. (B) Summary of body weight of affected adults and unaffected siblings (n = 4 adults/group). (C) Affected mutants have higher Mn levels compared to their unaffected siblings (n = 4 adults/group). (D) Example movement traces of affected adults and their unaffected siblings. (E) Affected adults swim shorter distances than their unaffected siblings (n = 6 adults/group). (F) Summary of the reproductive capacity of WT and mutant adults (n = 20 adults/group). (G) Example images of a wild-type and mutant embryo, showing a darker color in the brain and liver (red arrows) in the mutant. (H) Mn exposure causes a larger increase in Mn accumulation in mutant animals compared to wild-type animals (n = 3 sets of 200 embryos/group). (I) Example images of two mutant embryos after Mn exposure. Note the distorted body shape of the Mn-treated mutant. (J) Locomotion (measured as swimming and a normal escape response) is reduced in mutant embryos following Mn treatment, whereas wild-type animals are not affected (n = 3 sets of 20 embryos/group). (K) Mutant embryos exposed to Mn swim a shorter distance than untreated mutants and wild-type embryos (n = 6 embryos/group). (L) Slc32a1 expression is reduced in both wild-type and slc30a10 embryos following Mn exposure (n = 3 sets of 20 embryos/group). (M-N) Gabb1a (M) and gabb1b (N) expression is reduced in Mn-exposed slc30a10 mutants (n = 3 sets of 20 embryos/group). (O) Western blot analysis of Gad65/67 in wild-type and mutant embryos treated with or without Mn. (P-Q) In situ hybridization of dat and th in mutant embryos following Mn exposure, showing reduced expression of both genes compared to untreated mutants and WT embryos. (R) TUNEL staining in the brain of mutant embryos following Mn exposure, showing increased apoptosis compared to untreated mutants and WT embryos. *p<0.05, **p<0.01, and ***p<0.001; in K‒O, groups with different letters differed significantly (p<0.05). |
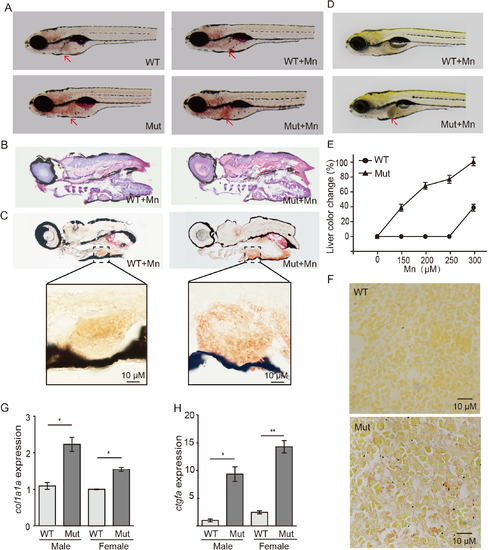
Slc30a10 mutant zebrafish develop liver damage. (A) Oil red O staining shows that mutant embryos have a slightly fatty liver (red arrows), which was worsened upon exposure to Mn. (B-C) HE staining (B) and Oil red O staining (C) of frozen sections showing hepatic steatosis in mutant embryos following Mn exposure. (D) Example images of a wild-type and mutant embryo under Mn exposure, showing a darker colored liver in the mutant (red arrow). (E) Dose-response curve showing the percentage of embryos with liver color change versus Mn concentration (n = 3 sets of 20 embryos/group). (F) Image of the liver of a wild-type and mutant adult, showing severe fibrosis in the mutant liver with sirius red staining. (G-H) The fibrosis markers col1a1a and ctgfa were measured in the liver of both male and female WT and mutant animals (n = 3 sets of 20 adults/group; *p<0.05 and **p<0.01). |
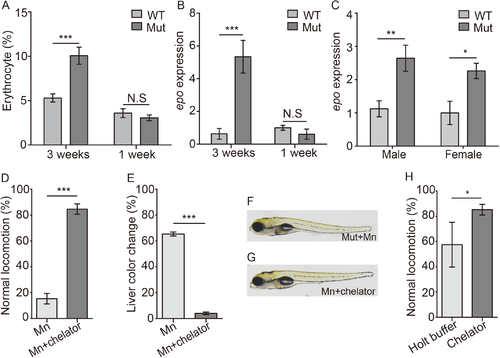
Slc30a10 mutant zebrafish develop polycythemia, and chelation treatments improves the phenotype in mutant embryos. (A) Summary of the relative numbers of erythrocytes in 3-week-old and 1-week-old embryos (n = 6 sets of 50 embryos/group). (B and C) Epo expression was measured in 3-week-old and 1-week-old mutant zebrafish (B) and in the liver of adult zebrafish (C); n = 3 sets of 20 adults/group. (D and E) Mn-induced locomotor defects (D) and the darker color in liver (E) were rescued by treating embryos with EDTA-CaNa2 (chelator, n = 3 sets of 20 embryos/group). (F-G) Example images of a Mn-exposed mutant embryo, showing a darker colored liver (F), and a Mn-exposed mutant embryo following EDTA-CaNa2 treatment (G). (H) Following exposure to 300 μM Mn, mutant embryos were transferred to either Holt buffer alone or Holt buffer containing EDTA-CaNa2, and locomotion was measured (n = 3 sets of 20 embryos/group). *p<0.05, **p<0.01, and ***p<0.001. PHENOTYPE:
|

ZFIN is incorporating published figure images and captions as part of an ongoing project. Figures from some publications have not yet been curated, or are not available for display because of copyright restrictions. |
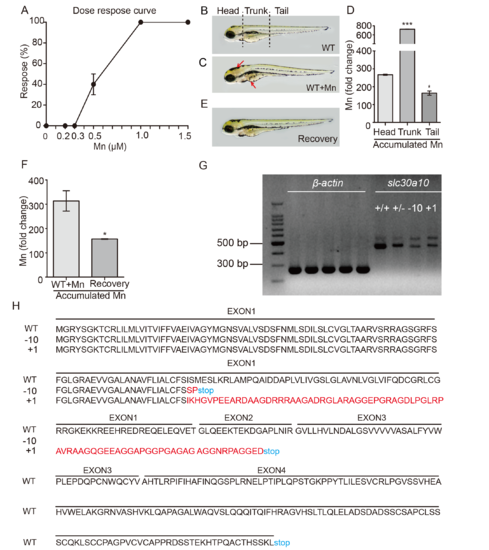
Zebrafish embryos are a suitable model for studying Mn metabolism. (A) Wild-type embryos were analyzed at 6 dpf following Mn exposure at the indicated concentration for 24 hours, and the percentage of embryos that responded (defined as impaired locomotion) is plotted against Mn concentration. (B and C) Mn accumulates in wild-type embryos exposed to 1 mM Mn for 24 hours, shown as a dark color in the brain and liver (C, red arrows). (D) Summary of the fold change in Mn in the three body regions of wild-type embryos exposed to 1 mM Mn for 24 hours. (E) 24 hours after transferring an Mn-exposed embryo to fresh Holt buffer, the color in the brain and liver returned to basal levels. (F) Summary of the fold change in Mn accumulation in Mn-exposed embryos that were transferred to fresh Holt buffer. (G) RT-PCR of slc30a10 mRNA in wild-type (+/+), heterozygous (+/-), homozygous 10-bp deletion (-10), and homozygous 1-bp insertion (+1) embryos. β-actin mRNA was measured as an internal control. (H) Predicted protein sequences of the wild-type (WT), -10, and +1 slc30a10 alleles generated using CRISPR/Cas9-based editing. PHENOTYPE:
|
|
ZFIN is incorporating published figure images and captions as part of an ongoing project. Figures from some publications have not yet been curated, or are not available for display because of copyright restrictions. PHENOTYPE:
|
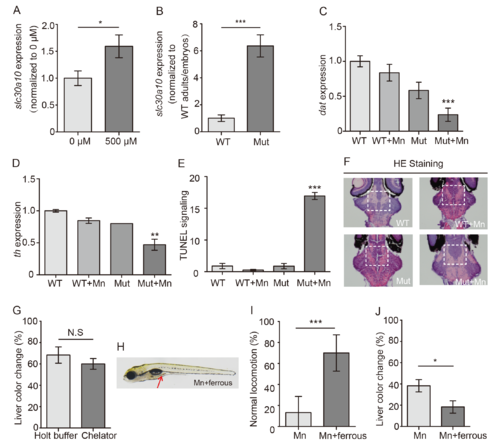
Phenotypic characterization and effect of ferrous fumarate on slc30a10 mutant embryos. (A) Slc30a10 mRNA was measured in heterozygous adults with or without Mn exposure. (B) Slc30a10 mRNA level was showed by a ratio of adults versus embryos in both wild-type and mutants. (C and D) Quantitative analyses of in situ staining for dat (C) and th (D) mRNA in WT and mutant embryos; where indicated, the embryos were exposed to Mn. (E) Quantitative analyses of TUNEL fluorescence. (F) HE staining in frozen sectioned brain of embryos. (G) Following Mn exposure, mutant embryos were transferred to either fresh Holt buffer of buffer containing the chelator EDTA-CaNa2, and the percentage of embryos with a color change in the liver is plotted (n = 3 sets of 20 embryos/group). (H) Image of a Mn-exposed mutant embryo after treatment with ferrous fumarate; note the brown color in the gut (arrow). (I and J) Summary of locomotion (I) and the percentage of embryos with a color change in the liver (J) in mutant Mn-exposed embryos treated with ferrous fumarate (n = 3 sets of 20 embryos/group). *p<0.05, **p<0.01, and ***p<0.001. PHENOTYPE:
|
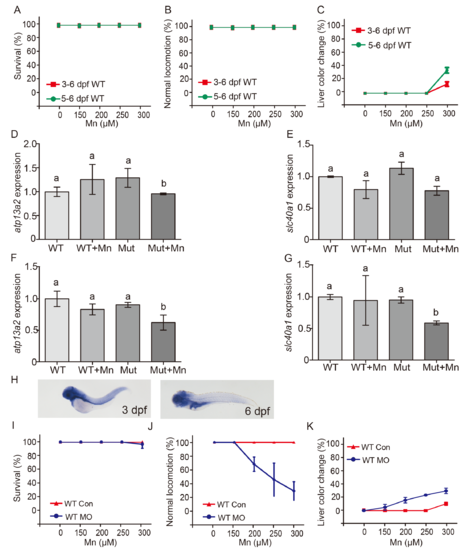
Atp2c1 functions as a Mn exporter in zebrafish embryos in early development. (A and B) Survival (A) and locomotor conditions (B) of wild-type embryos exposed to the indicated concentrations of Mn either for 72 h starting at day 3 dpf (3–6 dpf) or for 24 h starting at 5 dpf (5–6 dpf). (C) Percentage of embryos with a dark-colored liver after exposure to the indicated Mn concentrations. (D and E) Atp13a2 (D) and slc40a1 (E) mRNA levels were measured in wild-type and mutant embryos at 6 dpf; where indicated, the embryos were exposed to Mn at 3 dpf for 3 days. (F and G) Atp13a2 (F) and slc40a1 (G) mRNA levels were measured in wild-type and mutant embryos at 6 dpf; where indicated, the embryos were exposed to Mn at 5 dpf for 24 h. Groups with different letters differed significantly (p<0.05). (H) In situ hybridization for atp2c1 mRNA in wild-type embryos at 3 dpf and 6 dpf. (I-K) Wild-type embryos were injected with an atp2c1 morpholino (WT MO) or a scrambled morpholino (WT CON), then exposed to the indicated Mn concentration for 3 days at 3 dpf. (J and K) Injecting wild-type embryos with the atp2c1 morpholino facilitates Mn-induced locomotion deficits (J) and dark colored liver (K). |
|
ZFIN is incorporating published figure images and captions as part of an ongoing project. Figures from some publications have not yet been curated, or are not available for display because of copyright restrictions. PHENOTYPE:
|