
- Title
-
Interstitial fluid osmolarity modulates the action of differential tissue surface tension in progenitor cell segregation during gastrulation
- Authors
- Krens, S.F.G., Veldhuis, J.H., Barone, V., Čapek, D., Maître, J.L., Brodland, G.W., Heisenberg, C.P.
- Source
- Full text @ Development
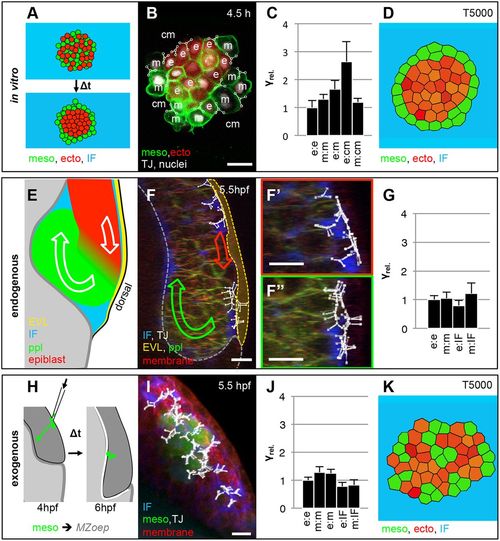
Relative interfacial tension distribution during cell segregation in vitro and in vivo. (A) Schematic illustration of the starting and end configurations for a typical heterotypical progenitor cell-sorting assay in vitro. (B) Single confocal image plane of a heterotypical aggregate consisting of ectoderm (ecto) and mesoderm (meso) progenitor cells expressing histone2A-mCherry in the nucleus (white) and Lyn-Venus at the plasma membrane (green) in all cells after 4.5 h in culture. Ectoderm progenitor cells were additionally labeled with cytoplasmic dextran-Alexa647 (red). Representative cell triple interfacial junctions (TJ, white) for cell-to-cell and cell-to-medium interfaces, as part of the CellFIT-3D based tensions analysis, were overlaid in the image as triple nodes in white with the different interfaces denoted as e (ectoderm), m (mesoderm) and cm (culture medium). Scale bar: 20 μm. For more details of the CellFIT-3D, see the supplementary Materials and Methods. (C) Relative interfacial tension distributions (γrel.) obtained by CellFIT-3D for all interface types present during in vitro cell sorting at 4.5 h in culture. Error bars show standard deviations. (D) Stable configurations of a finite element simulation of heterotypical progenitor cell sorting after 5000 computational iterations, using the CellFIT-3D obtained interfacial tensions shown in C with γe-e=1.00, γm-m=1.31, γe-m=1.66, γe-cm=2.65 and γm-cm=1.20. (E) Schematic illustration of mesoderm internalization in a lateral view through the dorsal germ ring margin at the onset of gastrulation. (F) 3D-rendered image of a Tg(gsc:eGFP) embryo at the onset of internalization (5.5 hpf) with ppl progenitor cells expressing eGFP (green), all cells expressing membrane-labeled Lyn-TagBFP (red), and the IF marked by dextran-rhodamine (blue). The image is overlaid with annotated triple junctions (TJ, white). The green and red arrows indicate global movement directions of mesoderm and ectoderm progenitor cells, respectively. The yellow dotted line demarcates the EVL. Scale bar: 20 μm. (F′,F″) Higher magnification views of the regions with ectoderm cells (F′, red) and ppl progenitor cells expressing eGFP (F″, green) from the image in F. Scale bars: 20 μm. (G) Relative interfacial tension distributions (γrel.) obtained by CellFIT-3D for all interface types present during gastrulation in vivo at 5.5 h with e (ectoderm), m (mesoderm) and IF (interstitial fluid). Error bars show standard deviations. (H) Schematic illustration of a typical transplanted mesoderm cell internalization experiment. (I) 3D-rendered image of Tg(βActin:Ras-eGFP) mesoderm cells (green) transplanted in a Lyn-TagBFP membrane-labeled (red) expressing Tg(dharma:eGFP);MZoep embryo at the onset of internalization (5.5 hpf) with the IF marked by dextran-rhodamine (blue) and overlaid with annotated triple junctions (TJ, white). Scale bar: 20 μm. (J) Relative interfacial tensions obtained by CellFIT-3D at the onset of mesoderm internalization with e (ectoderm), m (mesoderm) and IF (interstitial fluid). Error bars are standard deviations. (K) Stable configurations of a finite element simulation of heterotypical progenitor cell sorting after 5000 computational iterations, using the CellFIT-3D obtained interfacial tensions shown in J with γe-e=1.00, γm-m=1.28, γe-m=1.25, γe-IF=0.78 and γm-IF=0.83. |
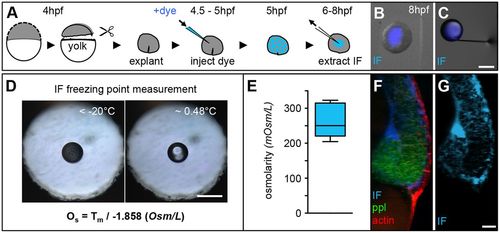
Measurements of interstitial fluid osmolarity. (A) Schematic illustration of animal cap explant preparation, and IF labelling and extraction procedures. (B,C) Overlaid images of an animal cap explant (gray scale) with IF-filled lumen (blue; B) and an extracted IF droplet (blue) at the tip of a glass capillary used for IF extraction (C). Scale bar: 200 μm. (D) Images of a droplet of IF floating in immersion oil placed within the sample-holder hole of a nanoliter osmometer in a frozen state (left) and directly after melting (right). The displayed formula was used to calculate the IF osmolarity, with Os denoting osmolarity (Osm/L) and Tm being the temperature of freeze point depression. Scale bar: 50 μm. (E) Box and whisker plot of the measured IF osmolarity (n=8 measurements). Black line indicates the median value; whiskers show the spread of the data. (F,G) 3D renderings of a lateral fluorescence image of the dorsal germ ring in a Tg(-4gsc:eGFP-Hsa.HRAS) embryo at the onset of gastrulation (6 hpf), expressing GFP in internalizing ppl progenitors (green), utrophin-mCherry to label the actin cell cortex of all cells (red) and dextran-Cascade Blue to label the IF (blue; F). (G) The same image showing dextran-Cascade Blue labeling of IF only. Scale bar: 20 μm. |
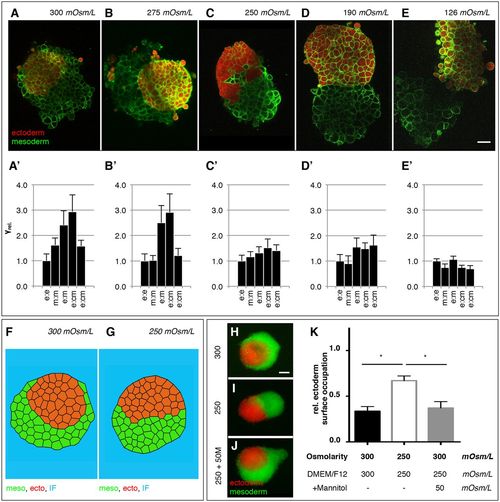
Modulation of progenitor cell interfacial tensions by medium osmolarity. (A-E) Representative single plane confocal images of tissue aggregates consisting of ectoderm or mesoderm progenitor cells expressing Lyn-Venus at the plasma membrane (green) of all cells and cultured for 5 h in the presence of medium with 300 (A), 275 (B), 250 (C), 190 (D) or 126 (E) mOsm/L osmolarity. Ectoderm aggregates were additionally labeled with cytoplasmic dextran-Alexa648 (red) (see also Movie 3). Scale bar: 50 μm. (A′-E′) Relative interfacial tensions (γrel.) obtained by 3D-CellFIT for enveloping tissues cultured for 5 h in the presence of medium with 300 (A′), 275 (B′), 250 (C′), 190 (D), 126 (D′) or 250 (E′) mOsm/L osmolarity with e (ectoderm), m (mesoderm) and cm (culture medium). Error bars indicate standard deviations. (F,G) Stable configurations of finite element simulations of tissue envelopment (10,000 simulation iterations) in heterotypic tissue aggregates consisting of ectoderm (red) or mesoderm (green) cells surrounded by culture medium (blue), using 3D-CellFIT-obtained tension distributions shown in A (300 mOsm/L) with γe-e=1.00, γm-m=1.62, γe-m=2.41, γe-cm=2.94, γm-cm=1.58; and in C (250 mOsm/L) with γe-e=1.00, γm-m=1.16, γe-m=1.32, γe-cm=1.52, γm-cm=1.41. (H-J) Tissue envelopment of ectoderm (red) and mesoderm (green) progenitor cell aggregates cultured for 5 h in the presence of ∼300 mOsm/L culture medium (n=20 engulfment assays; H), ∼250 mOsm/L osmolarity culture medium (n=24 engulfment assays; I) or culture medium containing mannitol to restore osmolarity from 250 mOsm/L to 300 mOsm/L (250+50 M; n=21 engulfment assays, J). (K) Degree of envelopment was quantified by calculating the relative ectoderm surface occupation taking the heterotypical cell aggregate size into account. Error bars are standard deviations; *P<0.05. |
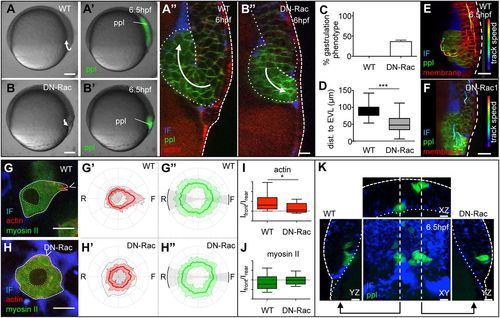
Mesoderm cell internalization relies on directed mesoderm cell migration. (A,A′,B,B′) Bright-field (A,B) and fluorescence images (A′,B′) of wild-type (A,A′) and DN-Rac expressing (B,B′) Tg(-4gsc:eGFP-Hsa.HRAS) embryos, expressing GFP in internalizing ppl progenitors (green) at the onset of gastrulation (5.5 hpf). Scale bars: 100 μm. (A″,B″) Orthogonal view of a confocal image stack of a wild-type (A″) and DN-Rac-expressing (B″) Tg(-4gsc:eGFP-Hsa.HRAS);Tg(βActin:Utrophin-mCherry) embryo at the onset of gastrulation (6 hpf), expressing GFP (green) in internalizing ppl progenitors and Utrophin-mCherry (red) marking actin in all cells. Transgenic embryos were also injected with dextran-rhodamine to label the IF (blue). Dashed line delineates the position of the EVL and dotted lines demarcate the deep cell mass. White arrows indicate the direction of mesoderm progenitor cell movement. Scale bar: 20 μm. (C) The fraction of DN-Rac-expressing and wild-type control embryos displaying defective mesoderm cell internalization (nWT=124 and nDN-Rac=95 embryos from three independent experiments). Error bars are standard deviations. (D) Box and whisker plot showing the distance of internalized mesoderm progenitors from the EVL in wild-type and DN-Rac-expressing embryos (nWT and nDN-Rac=264 cells from three embryos each; ***P<0.01). Black line indicates the median value; whiskers show the spread of the data. (E,F) Orthogonal views from a confocal image stack of internalizing ppl progenitors within the dorsal germ ring margin of wild-type (E) and DN-Rac-expressing (F) Tg(-4gsc:eGFP-Hsa.HRAS) embryo, expressing GFP in ppl progenitors (green) at shield stage (6.5 hpf). Transgenic embryos were also injected with Lyn-TagBFP mRNA to outline the membrane of all cells (red) and dextran-rhodamine to label the IF (blue). Cell tracks delineate the movements of exemplary mesoderm (green spheres) and ectoderm cells (red spheres) during internalization (5.7-6.5 hpf). Track speed calibration bar indicates cell migration speeds ranging from 0 to 3.6 μm/min, from blue to red. Scale bars: 20 μm. Dashed line delineates the position of the EVL. (G,H) Single plane confocal image of an exemplary transplanted Tg(βActin:myl12l-eGFP);Tg(βActin:Utrophin-mCherry) wild-type (G) and DN-Rac-expressing (H) ppl progenitor cell in vivo during internalization. The surrounding IF was labeled with dextran-Cascade Blue (blue). Scale bars: 10 μm. Arrowhead indicates the cell front. (G′,G″,H′,H″) Normalized fluorescence intensity values on the periphery of wild-type (G′,G″) and DN-Rac-expressing (H′,H″) ppl cells in Tg(βActin:myl12l-eGFP);Tg(βActin:Utrophin-mCherry) embryos at shield stage (6 hpf) shown as polar plots for actin (Utrophin-mCherry; G′,H′) and myosin II (myl12l-eGFP; G″,H″) with the front and rear areas annotated. Standard deviations are indicated as lines perpendicular to the mean. n=18 cells (5 embryos) for wild type; n=16 cells (4 embryos) for DN-Rac. (I,J) Box and whisker plots of actin (I) and myosin II (J) intensity ratios of the front versus the rear in wild-type and DN-Rac-expressing ppl cells. Black line indicates the median value; whiskers show the spread of the data; dashed line indicate a value of 1 (equal intensity front versus rear); *P<0.05. (K) 3D rendered image planes [XY, dorsal view with animal pole towards the top; XZ, transverse view with outside (EVL) towards the top; YZ, lateral view with animal pole towards the top] of wild-type (left) and DN-Rac-expressing (right) Tg(-4gsc:eGFP-Hsa.HRAS) donor cells (green) transplanted adjacent to each other into the dorsal germ ring margin of a wild-type host embryo at shield stage (6 hpf). Host embryos were injected with dextran-rhodamine to label the IF (blue). Straight dashed lines in the middle panel indicate the image planes of the neighboring panels. Dotted lines outline the deep cell mass. ppl, prechordal plate progenitor cells; EVL, enveloping layer; IF, interstitial fluid. Scale bars: 20 μm. |
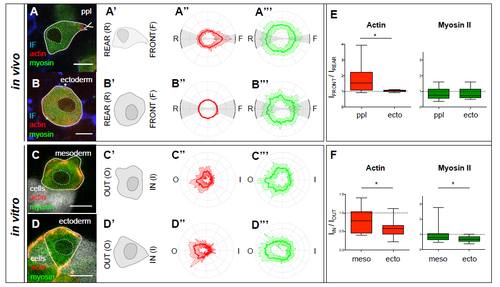
Subcellular localization of actin and myosin II in ectoderm and mesoderm progenitors in vitro and in vivo.(A-D) Single confocal image plane of an exemplary Tg(βActin:myl12leGFP); Tg(βActin:Utrophin-mCherry) mesoderm (ppl) (A,C) and ectoderm (B,D) progenitor cell in vivo (A,B) with the surrounding IF labelled by Dextran-Cascade Blue® (blue), and in vitro (C,D) with adjacent cells labelled with Dextran- Alexa647 (white). Scale bars, 10 μm. (A'-D') Schematic illustration of the cells shown in (A-D) with their leading (front) and trailing edges (back) and cellmedium (out) and cell-cell (in) interfaces indicated. (A''-D'', A'''-D''') Normalized fluorescence intensity values on the periphery of mesoderm (ppl) (A'',A''',C'',C''') and ectoderm (B'',B''',D'',D''') cells from Tg(βActin:myl12leGFP); Tg(βActin:Utrophin-mCherry) embryos either in vitro (A'',A''',B'',B''') or within embryos at shield stage in vivo (6 hpf; C'',C''',D'',D''') shown as polar plots for actin (Utrophin-mCherry; A''-D'') and myosin II (myl12l-eGFP; A'''-D''') with the front and rear areas (in vivo) and ‘out' and ‘in' interfaces (in vitro) annotated. Standard deviation is indicated as perpendicular lines to the mean. n (ppl in vivo) = 21 cells (5 embryos), n (ectoderm in vivo) = 8 cells (5 embryos), n (mesoderm in vitro) = 18 cells (3 cell aggregates), n (ectoderm in vitro) =18 cells (3 cell aggregates). (E,F) Box-whisker plot of intensity ratios of actin (red) and myosin II (green), from the intensity profiles shown in (A''-D'', A'''-D'''), of the front versus the rear of ppl and ectoderm cells in vivo (E), and medium-facing outside and aggregate-facing inside of induced mesoderm and ectoderm progenitor cells on the surface of a heterotypical cell aggregate during cell sorting in vitro (F). Black line indicates the median value; whiskers show the spread of the data; dashed line indicates a value of 1 (equal intensity front versus rear); * p < 0.05. |
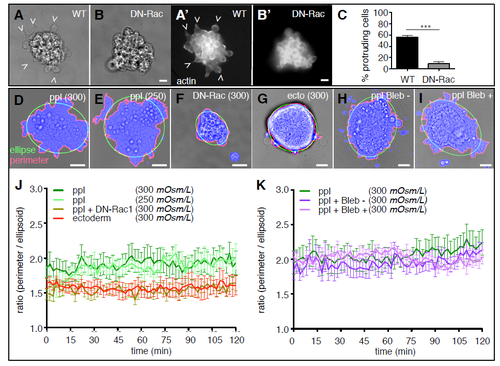
Protrusion formation in mesoderm (ppl) and ectoderm progenitor cells in vitro. (A,A',B,B') Bright-field (A,B) and fluorescence images (A',B') of WT (A,A') and DN-Rac expressing (B,B') Tg(βActin:Utrophin-mCherry) ppl progenitor cells plated on fibronectin-coated substrates for 1.5 h to monitor their protrusion formation in vitro. Scale bars, 10 μm. (C) Bar graph showing the percentage of protrusion forming ppl cells at the cell aggregate periphery. n (WT) = 14 and n (DN-Rac) = 15 experiments. Error bars are standard deviations; *** p < 0.01. (D-I) Bright-field images of WT ppl (D,E,H,I), DN-Rac expressing ppl (F) and ectoderm (G) progenitor cell clusters plated on fibronectin-coated substrates and cultured in 300 mOsm/L (D,F,G,H,I) or 250 mOsm/L (E), supplemented with either Blebbistatin - (H) or Blebbistatin + (I) to monitor their protrusion formation in vitro for 2 h. Scale bars, 20 μm. (J) Line graph showing the quantification of protrusive activity by plotting the calculated difference between the plated cell cluster perimeter (red lines in D-I) of the segmented cells clusters (blue area in D-I) and a fitted ellipsoid with the same area (red lines in D-I) over time. n (ppl, 300 mOsm/L) = 8, (ppl, 250 mOsm/L) = 4 , n (ppl + DNRac) = 8 , n (ectoderm) = 4 experiments. (K) Line graph showing the same quantification approach as in (J) for a separate experimental data set of ppl progenitor cell cluster cultured in 300 mOsm/L supplemented with blebbistatin isoforms, n (ppl) = 7 , n (ppl + Bleb-) = 6 , n (ppl + Bleb+) = 6 experiments. |
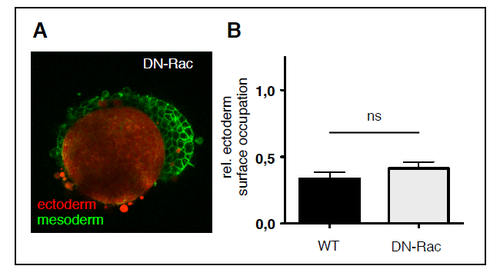
Envelopment of ectoderm and mesoderm cell aggregates overexpressing DN-rac in vitro. (A) Representative single plane confocal images of tissue aggregates consisting of ectoderm or mesoderm progenitor cells cultured for 5 h in the presence of medium with 300 (A) and 250 mOsm/L osmolarity. Both ectoderm and mesoderm cells express DN-Rac, and Lyn-Venus at the plasma membrane (green). Ectoderm aggregates were additionally labeled with cytoplasmic Dextran-Alexa648 (red). Scale bar, 50 μm. (B) Degree of envelopment was quantified by calculating the relative ectoderm surface occupation taking the heterotypical cell aggregate size into account. Error bars are standard deviations. |
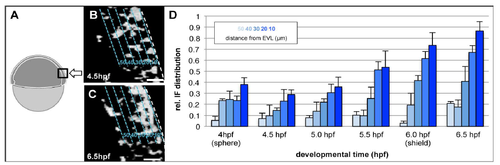
Interstitial Ouid accumulation within the blastoderm. (A) Schematic Illustration of the imaged region within the embryo used for interstitial fluid (IF} quantification, (B,C) Binary converted single plane confocal images of the epiblast with its surface pointing to the right and its IF labelled with Dextran·Rhodamin in embryos at 30 % (4.5 hpf, B) and 60 % (6.5 hpf, C) epiboly stages. Dashed lines (cyan) indicate 5 x 10 µm bins used for If quantification. Light-to-dark colouring Indicates the distance of the binned region from the EVL in µm, Scale bars, 20 µm. (D) Bar-graph presenting the average IF-to-ceU space filling ratios per 10 µrn bin from the epiblast surface (0 111n, light blue) to its inside (SO µm, dark blue) in embryos from sphere (4 hpl1 to shje)d St'o:1ge (6 hpf). Error bars, standard deviation within the analysed bin. |