
Fig. S5
- ID
- ZDB-FIG-170614-11
- Publication
- Krens et al., 2017 - Interstitial fluid osmolarity modulates the action of differential tissue surface tension in progenitor cell segregation during gastrulation
- Other Figures
- All Figure Page
- Back to All Figure Page
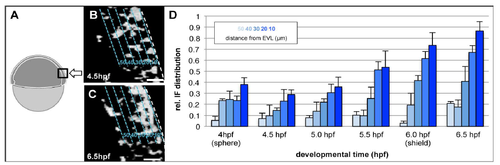
Interstitial Ouid accumulation within the blastoderm. (A) Schematic Illustration of the imaged region within the embryo used for interstitial fluid (IF} quantification, (B,C) Binary converted single plane confocal images of the epiblast with its surface pointing to the right and its IF labelled with Dextran·Rhodamin in embryos at 30 % (4.5 hpf, B) and 60 % (6.5 hpf, C) epiboly stages. Dashed lines (cyan) indicate 5 x 10 µm bins used for If quantification. Light-to-dark colouring Indicates the distance of the binned region from the EVL in µm, Scale bars, 20 µm. (D) Bar-graph presenting the average IF-to-ceU space filling ratios per 10 µrn bin from the epiblast surface (0 111n, light blue) to its inside (SO µm, dark blue) in embryos from sphere (4 hpl1 to shje)d St'o:1ge (6 hpf). Error bars, standard deviation within the analysed bin. |