
|
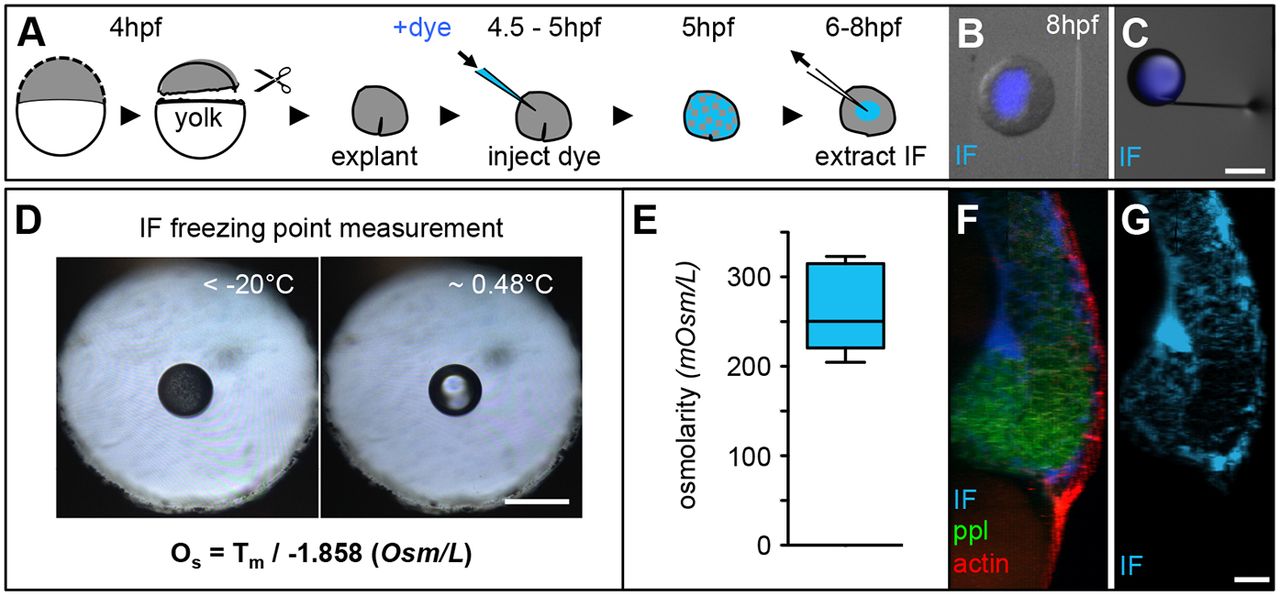
Fig. 2
Measurements of interstitial fluid osmolarity. (A) Schematic illustration of animal cap explant preparation, and IF labelling and extraction procedures. (B,C) Overlaid images of an animal cap explant (gray scale) with IF-filled lumen (blue; B) and an extracted IF droplet (blue) at the tip of a glass capillary used for IF extraction (C). Scale bar: 200 μm. (D) Images of a droplet of IF floating in immersion oil placed within the sample-holder hole of a nanoliter osmometer in a frozen state (left) and directly after melting (right). The displayed formula was used to calculate the IF osmolarity, with Os denoting osmolarity (Osm/L) and Tm being the temperature of freeze point depression. Scale bar: 50 μm. (E) Box and whisker plot of the measured IF osmolarity (n=8 measurements). Black line indicates the median value; whiskers show the spread of the data. (F,G) 3D renderings of a lateral fluorescence image of the dorsal germ ring in a Tg(-4gsc:eGFP-Hsa.HRAS) embryo at the onset of gastrulation (6 hpf), expressing GFP in internalizing ppl progenitors (green), utrophin-mCherry to label the actin cell cortex of all cells (red) and dextran-Cascade Blue to label the IF (blue; F). (G) The same image showing dextran-Cascade Blue labeling of IF only. Scale bar: 20 μm.