
|
Fig. 4
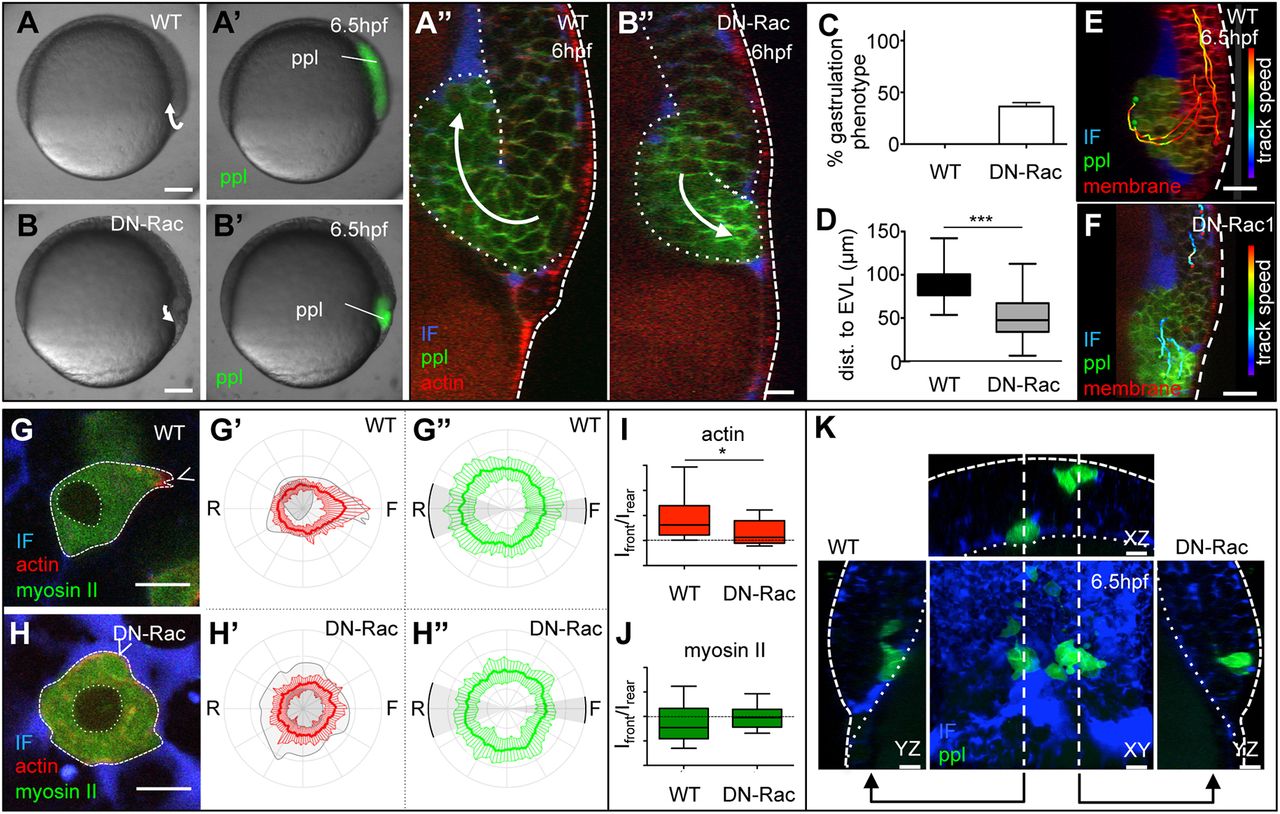
Mesoderm cell internalization relies on directed mesoderm cell migration. (A,A′,B,B′) Bright-field (A,B) and fluorescence images (A′,B′) of wild-type (A,A′) and DN-Rac expressing (B,B′) Tg(-4gsc:eGFP-Hsa.HRAS) embryos, expressing GFP in internalizing ppl progenitors (green) at the onset of gastrulation (5.5 hpf). Scale bars: 100 μm. (A″,B″) Orthogonal view of a confocal image stack of a wild-type (A″) and DN-Rac-expressing (B″) Tg(-4gsc:eGFP-Hsa.HRAS);Tg(βActin:Utrophin-mCherry) embryo at the onset of gastrulation (6 hpf), expressing GFP (green) in internalizing ppl progenitors and Utrophin-mCherry (red) marking actin in all cells. Transgenic embryos were also injected with dextran-rhodamine to label the IF (blue). Dashed line delineates the position of the EVL and dotted lines demarcate the deep cell mass. White arrows indicate the direction of mesoderm progenitor cell movement. Scale bar: 20 μm. (C) The fraction of DN-Rac-expressing and wild-type control embryos displaying defective mesoderm cell internalization (nWT=124 and nDN-Rac=95 embryos from three independent experiments). Error bars are standard deviations. (D) Box and whisker plot showing the distance of internalized mesoderm progenitors from the EVL in wild-type and DN-Rac-expressing embryos (nWT and nDN-Rac=264 cells from three embryos each; ***P<0.01). Black line indicates the median value; whiskers show the spread of the data. (E,F) Orthogonal views from a confocal image stack of internalizing ppl progenitors within the dorsal germ ring margin of wild-type (E) and DN-Rac-expressing (F) Tg(-4gsc:eGFP-Hsa.HRAS) embryo, expressing GFP in ppl progenitors (green) at shield stage (6.5 hpf). Transgenic embryos were also injected with Lyn-TagBFP mRNA to outline the membrane of all cells (red) and dextran-rhodamine to label the IF (blue). Cell tracks delineate the movements of exemplary mesoderm (green spheres) and ectoderm cells (red spheres) during internalization (5.7-6.5 hpf). Track speed calibration bar indicates cell migration speeds ranging from 0 to 3.6 μm/min, from blue to red. Scale bars: 20 μm. Dashed line delineates the position of the EVL. (G,H) Single plane confocal image of an exemplary transplanted Tg(βActin:myl12l-eGFP);Tg(βActin:Utrophin-mCherry) wild-type (G) and DN-Rac-expressing (H) ppl progenitor cell in vivo during internalization. The surrounding IF was labeled with dextran-Cascade Blue (blue). Scale bars: 10 μm. Arrowhead indicates the cell front. (G′,G″,H′,H″) Normalized fluorescence intensity values on the periphery of wild-type (G′,G″) and DN-Rac-expressing (H′,H″) ppl cells in Tg(βActin:myl12l-eGFP);Tg(βActin:Utrophin-mCherry) embryos at shield stage (6 hpf) shown as polar plots for actin (Utrophin-mCherry; G′,H′) and myosin II (myl12l-eGFP; G″,H″) with the front and rear areas annotated. Standard deviations are indicated as lines perpendicular to the mean. n=18 cells (5 embryos) for wild type; n=16 cells (4 embryos) for DN-Rac. (I,J) Box and whisker plots of actin (I) and myosin II (J) intensity ratios of the front versus the rear in wild-type and DN-Rac-expressing ppl cells. Black line indicates the median value; whiskers show the spread of the data; dashed line indicate a value of 1 (equal intensity front versus rear); *P<0.05. (K) 3D rendered image planes [XY, dorsal view with animal pole towards the top; XZ, transverse view with outside (EVL) towards the top; YZ, lateral view with animal pole towards the top] of wild-type (left) and DN-Rac-expressing (right) Tg(-4gsc:eGFP-Hsa.HRAS) donor cells (green) transplanted adjacent to each other into the dorsal germ ring margin of a wild-type host embryo at shield stage (6 hpf). Host embryos were injected with dextran-rhodamine to label the IF (blue). Straight dashed lines in the middle panel indicate the image planes of the neighboring panels. Dotted lines outline the deep cell mass. ppl, prechordal plate progenitor cells; EVL, enveloping layer; IF, interstitial fluid. Scale bars: 20 μm.