
- Title
-
Dynamic regulation of Pin1 expression and function during zebrafish development
- Authors
- Ibarra, M.S., Borini Etichetti, C., Di Benedetto, C., Rosano, G.L., Margarit, E., Del Sal, G., Mione, M., Girardini, J.
- Source
- Full text @ PLoS One

Analysis of pin1 mRNA levels and distribution during zebrafish development. (A) pin1 mRNA levels were monitored by RT-qPCR on cDNA from embryos of the indicated stages: 1–2 cell (0 hpf), dome (4:30 hpf), shield (6 hpf), 2 somites (10:30 hpf), 20 somites (19 hpf),1 dpf, 2 dpf, 3 dpf, 4 dpf and 6 dpf. Data was normalized using elongation factor 1α(ef1α) and ribosomal protein L13a (rpl13a) mRNA levels as internal controls and is shown as relative abundance comparing with 1–2 cell stage. (B) Analysis of pin1 mRNA levels by semi quantitative RT-PCR: 1-2-cell (0 hpf), 64-cell (2 hpf), high (3:30 hpf), sphere (4 hpf) and 40%-epiboly (5 hpf). As an internal control, ef1αwas amplified on the same cDNA samples. Signal intensity was quantified using ImageJ software and expressed relative to 1–2 cell stage. (C) pin1 mRNA distribution in whole embryos at the indicated developmental stages analysed by in situ hybridization (100 x magnification). (D) pin1 mRNA pattern in the head at prim-5 (24 hpf) and long-pec (48 hpf) stages. Left: dorsal, center: lateral, right: frontal (200 x magnification). hpf, hours post-fecundation, dpf, days post-fecundation. T: telencephalon, D: diencephalon, C: cerebellum. |

ZFIN is incorporating published figure images and captions as part of an ongoing project. Figures from some publications have not yet been curated, or are not available for display because of copyright restrictions. |

Analysis of Pin1 distribution in zebrafish embryos. Confocal images of whole-mount immunofluorescence performed on embryos from different stages using Pin1 antibody. (A) Dome (4:30 hpf) and Bud stage (10 hpf). (B) 14-somite stage (16 hpf), lateral views from the head (upper panels) and tail (lower panels). (C) Prim-5 stage (24 hpf), frontal view of the head (upper panels), dorsolateral view of the head (middle panels) and lateral view of the tail. (D) Long-pec stage (48 hpf), dorsolateral view of the head (upper panels), lateral view of the head (middle panels) and lateral view of the tail (lower panels). Nuclei were stained with Hoechst. Scale bar = 25 μm. |

pin1 mRNA injection affects head development in zebrafish. (A) Lateral views of live 3 dpf embryos injected with EGFP mRNA or EGFP-Pin1 mRNA (Pin1) at 1–2 cell stage. (B) Quantification of the percentage of embryos with altered head development upon injection of mRNAs coding for EGFP, EGFP-Pin1, EGFP-Pin1C109A or EGFP-WW, as indicated. Embryos with evident facial retraction, reduced mandible and/or reduced head size were scored as positive. The graph shows the average of 4 experiments with at least 50 embryos each and the standard deviation. Statistical analysis were carried out using one-way ANOVA followed by Tukey's Multiple Comparison Test: *** p˂ 0,0001. (C) Representative confocal projections of embryos microinjected with EGFP mRNA or EGFP-Pin1 mRNA, stained for apoptosis by whole-mount TUNEL assay (left panels) or for proliferation by p-H3 whole-mount immunofluorescence (right panels). (D) Quantification of apoptotic cells on heads of wild type (wt) or tp53 zdf1/zdf1 embryos microinjected with EGFP mRNA or EGFP-Pin1 mRNA as indicated. Statistical analyses were carried out using one-way ANOVA followed by Tukey's Multiple Comparison Test: *** p˂ 0,0001 (n = 17 for each condition). (E) Quantification of cells positive for p-H3 staining on heads of wild type embryos microinjected with EGFP mRNA or EGFP-Pin1 mRNA as indicated. Statistical analyses were carried out using unpaired t test with Welch's correction (n = 21 for each condition). (F) Morphological analysis at 3 dpf of wild type or tp53 zdf1/zdf1 embryos microinjected with EGFP mRNA or EGFP-Pin1 mRNA as indicated. The graph shows the average of 4 experiments with at least 50 embryos each and the standard deviation. Statistical analysis were carried out using one-way ANOVA followed by Tukey's Multiple Comparison Test: *** p˂ 0,0001. |

Analysis of Pin1 expression in the adult zebrafish brain. Immunofluorescence analysis on brain coronal sections using Pin1 (green) or HuC/D (red) as primary antibodies. (A) and (B) dorsal telencephalon, (C) ventral diencephalon, (D) optic tectum, (E) corpus cerebelli, (F) romboencephalic ventricular zone. DiV: diencephalic ventricle, Dd: lateral zone of dorsal telencephalon, Dm: medial zone of dorsal telencephalon, GL: cerebellar granular layer, Hv: ventral zone of periventricular hypothalamus, IML: cerebellar intermediate layer, PGZ: periventricular gray zone of the optic tectum, RV: romboencephalic ventricle, TelV: telencephalic ventricle. Scale bar = 50 μm. EXPRESSION / LABELING:
|
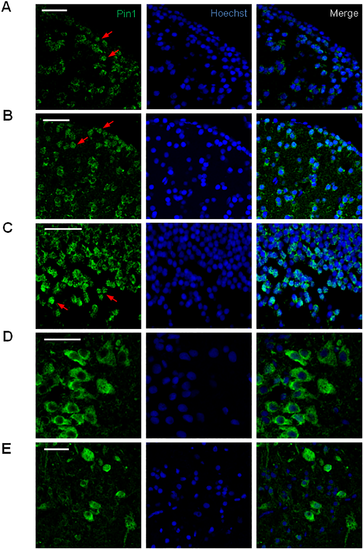
Pin1 subcellular localization in the adult zebrafish brain. Confocal Immunofluorescence analysis on brain coronal sections using Pin1 (green) as primary antibody. Nuclei were stained with Hoechst (blue). Digital magnification of selected areas from images shown in Fig 5 and S6 Fig. (A) lateral zone of dorsal telencephalic area, (B) diffuse nucleus of the inferior lobe, (C) periventricular gray zone of the optic tectum, (D) lateral zone of rostroventral medulla oblongata, (E) central area of caudal medulla oblongata. Scale bar = 25 μm. EXPRESSION / LABELING:
|
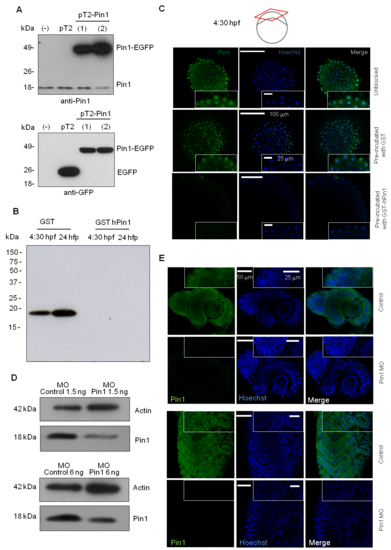
Pin1 polyclonal antibody specifically recognizes D. rerio Pin1. (A) Western blot analysis of extracts from HEK-293 cells transfected with pT2-Pin1 or pT2AL500R150G (pT2) probed with Pin1 antibody (upper panel) or GFP antibody (lower panel), (-) untransfected cells, (1) and (2) indicate two independent transfections. (B) Western blot analysis of embryonic extracts from the indicated stages with Pin1 antibody pre-absorbed with recombinant GST or GST-hPin1. (C) Whole-mount immunofluorescence of 4:30 hpf embryos with untreated Pin1 antibody (upper panels), Pin1 antibody pre-absorbed with recombinant GST (middle panels) or pre-absorbed with GST-hPin1 (lower panels). The insets show digital magnifications of selected regions from each image. (D) Zebrafish embryos were microinjected at 1 cell-stage with 1.5 or 6 ng of control or Pin1 specific morpholinos (MO), and upon 24 hours, western blot was performed on protein extracts using anti Pin1 and anti Actin as loading control (E) Whole-mount immunofluorescence of 6 ng Pin1 MO or control MO microinjected embryos at 24 hpf using Pin1 antibody, showing part of the head (upper panels), or trunk (lower panels). The insets show digital magnifications of selected regions from each image. |
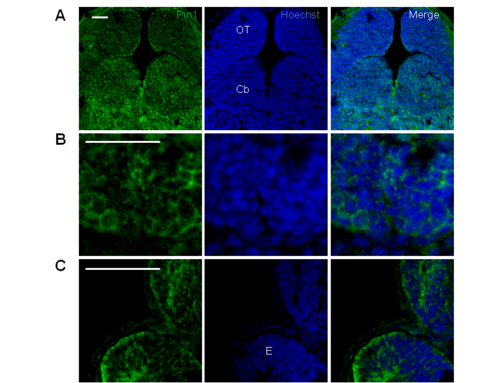
Analysis of Pin1 expression in 48 hpf zebrafish embryo sections. Immunofluorescence was performed on 5 μm coronal sections from 48 hpf embryos that were fixed and embedded in paraffin. Pin1 polyclonal antibody (green) was used and nuclei were stained with Hoechst (blue). (A) horizontal section showing part of the midbrain and hindbrain, (B) coronal section of the ventral telencephalon, (C) coronal section showing part of the eye cup and of the lateral region of the diencephalon. OT: optic tectum, Cb: cerebellum, E: eye. Scale bar = 50 μm. EXPRESSION / LABELING:
|

Analysis of Pin1 expression in the adult zebrafish brain. Confocal Immunofluorescence analysis on brain coronal sections using Pin1 (green, upper panels) as primary antibody. Nuclei were stained with Hoechst (blue). (A) olfactory bulb (B) telencephalic lobe, (C) ventral diencephalon (D) midbrain, (E) cerebellum and medulla oblongata, (F) medulla oblongata (caudal) (G) medulla spinalis. Scale bar = 100 μm. |
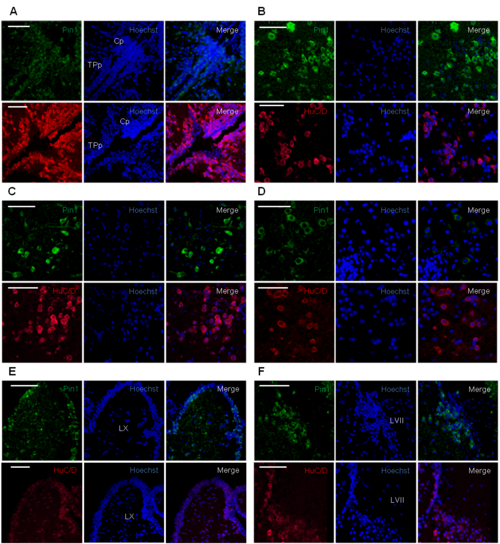
Regions enriched in Pin1 expressing cells in the adult zebrafish brain. Confocal Immunofluorescence analysis on brain coronal sections using Pin1 (green) or HuC/D (red) as primary antibodies. Nuclei were stained with Hoechst (blue). (A) diencephalic ventricle (B) lateral zone of rostroventral medulla oblongata, (C) and (D) central area of caudal medulla oblongata, (E) lobus vagus, (F) lobus facialis. Cp: central posterior thalamic nucleus, LVII: lobus facialis, LX: lobus vagus, TPp: periventricular nucleus of posterior tuberculum. Scale bar = 50 μm. |