
Image
|
Figure Caption
Fig. S3
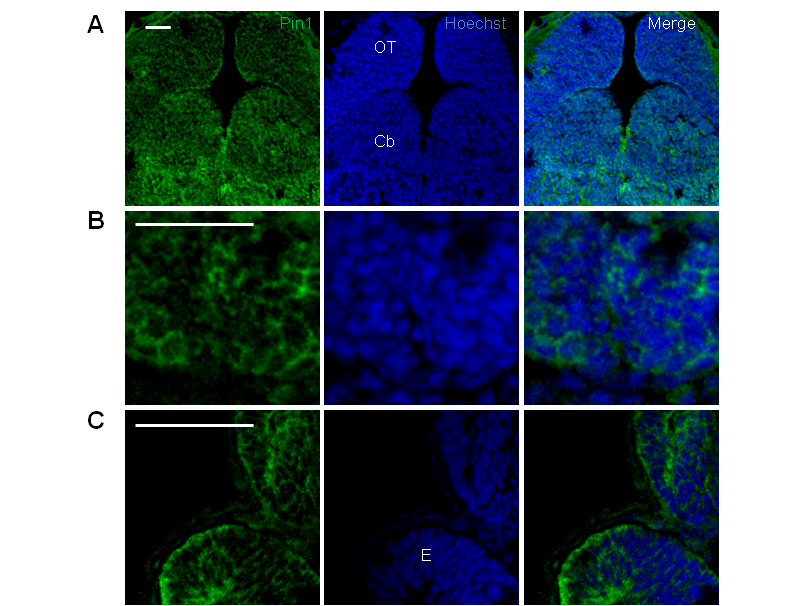
Analysis of Pin1 expression in 48 hpf zebrafish embryo sections.
Immunofluorescence was performed on 5 μm coronal sections from 48 hpf embryos that were fixed and embedded in paraffin. Pin1 polyclonal antibody (green) was used and nuclei were stained with Hoechst (blue). (A) horizontal section showing part of the midbrain and hindbrain, (B) coronal section of the ventral telencephalon, (C) coronal section showing part of the eye cup and of the lateral region of the diencephalon. OT: optic tectum, Cb: cerebellum, E: eye. Scale bar = 50 μm.
Figure Data
Acknowledgments
This image is the copyrighted work of the attributed author or publisher, and
ZFIN has permission only to display this image to its users.
Additional permissions should be obtained from the applicable author or publisher of the image.
Full text @ PLoS One