
- Title
-
tomm22 Knockdown-Mediated Hepatocyte Damages Elicit Both the Formation of Hybrid Hepatocytes and Biliary Conversion to Hepatocytes in Zebrafish Larvae.
- Authors
- Wu, J., Choi, T.Y., Shin, D.
- Source
- Full text @ Gene Expr.
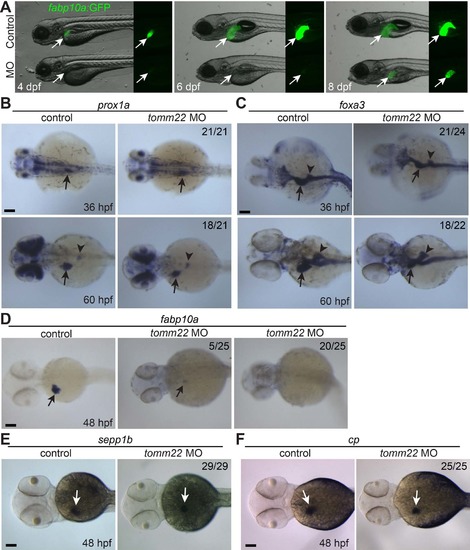
tomm22 knockdown reduces liver size. (A) Fluorescence images showing hepatic fabp10a:GFP expression (arrows) in tomm22 MO-injected larvae. Note very weak fabp10a:GFP expression until 6 days postfertilization (dpf) but its strong expression at 8 dpf. (B–E) Whole-mount in situ hybridization images showing the expression of prox1a, foxa3, fabp10a, sepp1b, and cp in the MO-injected embryos. Numbers indicate the proportion of larvae exhibiting the representative expression shown. Arrows point to the liver bud or the liver; arrowheads point to the dorsal pancreas. Scale bars: 100 μm. |
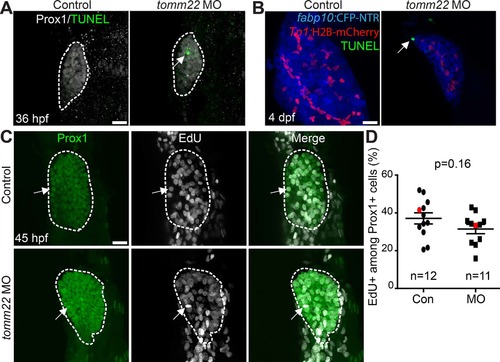
Cell death and proliferation in tomm22 MO-injected larvae. (A) Confocal projection images showing Prox1 expression (gray) and terminal deoxynucleotidyl transferase (TdT) dUTP nick-end labeling (TUNEL) (green) in the liver bud (dashed lines) at 36 h postfertilization (hpf). Arrow points to TUNEL+ cells. (B) Confocal projection images showing TUNEL (green) and the expression of fabp10a:CFP-NTR (blue) and Tp1:H2B-mCherry (red) in the liver at 4 dpf. Arrow points to TUNEL+ hepatocytes. (C) Confocal projection images showing Prox1 expression (green) and 5-ethynyl-2′-deoxyuridine (EdU) labeling (gray) in the liver (dashed lines) at 45 hpf. Arrows point to EdU/Prox1 double-positive cells. (D) Graph showing the percentage of EdU+ cells among Prox1+ cells in the liver at 45 hpf. There was no significant difference in the proliferation rate between the control and tomm22 MO-injected larvae. Red marks indicate the embryos shown in (C); n indicates the number of larvae examined. Scale bars: 20 μm; error bars: ±SEM. |
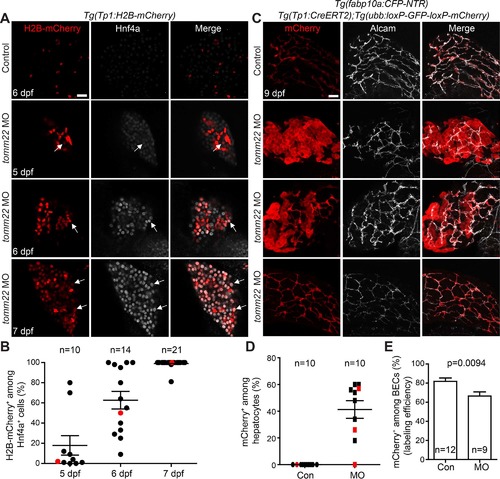
Biliary epithelial cells (BECs) give rise to hepatocytes in tomm22 MO-injected larvae. (A) Confocal single-optical section images showing Tp1:H2B-mCherry (red) and Hnf4a (gray) expression in the liver. Arrows point to H2B-mCherry/Hnf4a double-positive cells. (B) A graph showing the percentage of H2B-mCherry+ cells among Hnf4a+ cells in the livers of the tomm22 MO-injected larvae. Red dots indicate the larvae shown in (A). (C) Confocal projection images showing the hepatic expression of ubb:mCherry (red, Cre-labeled cells) and Alcam (gray, BECs) at 9 dpf. 4-OHT was treated from 48 to 84 hpf. (D) Graph showing the percentage of ubb:mCherry+ hepatocytes, which were derived from BECs. fabp10a:CFP-NTR expression was used to define hepatocytes. Red marks indicate the larvae shown in (C). (E) Graph showing the percentage of mCherry+ cells among Alcam+ BECs at 9 dpf, indicating Cre-mediated labeling efficiency. n indicates the number of larvae examined. Scale bars: 20 μm; error bars: ±SEM. |
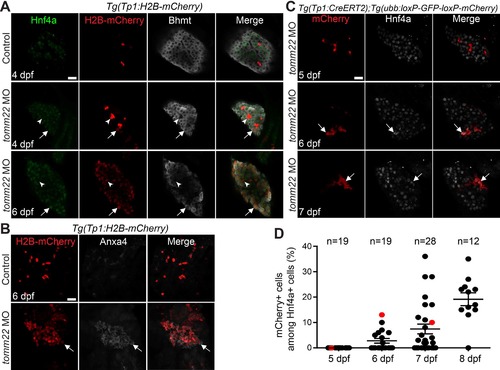
Surviving hepatocytes become hybrid hepatocytes. (A) Confocal single-optical section images showing the expression of Hnf4a (green), Tp1:H2B-mCherry (red), and Bhmt (gray) in the liver. Arrows point to hepatocytes that express Tp1:H2B-mCherry; arrowheads point to BECs negative for Hnf4a and Bhmt. (B) Confocal projection images showing Tp1:H2B-mCherry (red) and Anxa4 (gray) expression in the liver. Arrows point to H2B-mCherry/Anxa4 double-positive cells. (C) Confocal single-optical section images showing the hepatic expression of ubb:mCherry (red, Cre-labeled cells) and Hnf4a (gray) in tomm22 MO-injected larvae. Arrows point to mCherry/Hnf4a double-positive cells. (D) Graph showing the percentage of ubb:mCherry+ cells among Hnf4a+ cells, which were derived from BECs. Red dots indicate the larvae shown in (C); n indicates the number of larvae examined. Scale bars: 20 μm; error bars: ±SEM. |
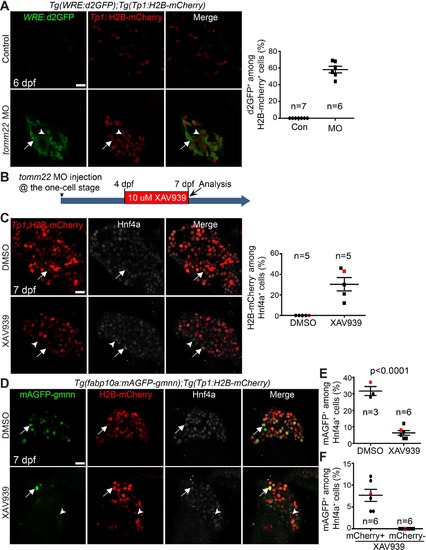
Suppression of Wnt/β-catenin signaling represses hepatocyte proliferation and the formation of hybrid hepatocytes in tomm22 MO-injected larvae. (A) Confocal single-optical section images showing WRE:d2GFP (green) and Tp1:H2B-mCherry (red) expression in the liver at 6 dpf. Arrows point to d2GFP/H2B-mCherry double-positive cells; arrowheads point to H2B-mCherry single-positive cells. Quantification of the percentage of d2GFP+ cells among H2B-mCherry+ cells is shown. (B) Scheme illustrating the period of XAV939 treatment for (C)–(F). (C) Confocal single-optical section images showing the hepatic expression of Tp1:H2B-mCherry (red) and Hnf4a (gray) at 7 dpf. Arrows point to H2B-mCherry/Hnf4a double-positive cells; arrowheads point to H2B-mCherry−/Hnf4a+ cells. Quantification of the percentage of H2B-mCherry− cells among Hnf4a+ cells is shown. (D) Confocal single-optical images showing the hepatic expression of fabp10a:mAGFP-gmnn (green), Tp1:H2B-mCherry (red), and Hnf4a (gray) at 7 dpf. Arrows point to mAGFP-gmnn/H2B-mCherry/Hnf4a triple-positive cells; arrowheads point to mAGFP-gmnn/Hnf4a double-positive cells. (E) Graph showing the percentage of mAGFP-gmnn+ cells among Hnf4a+ cells. Red marks indicate the larvae shown in (D). (F) Graph showing the percentage of mCherry+ or mCherry− proliferating hepatocytes. Red marks indicate the larvae shown in (D). n indicates the number of larvae examined. Scale bars: 20 μm; error bars: ±SEM. |
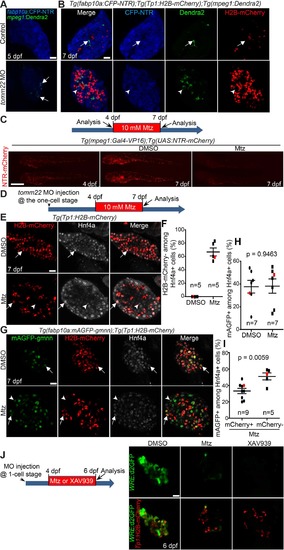
Macrophage ablation impairs the formation of hybrid hepatocytes in tomm22 MO-injected larvae. (A) Confocal single-optical section images showing the expression of mpeg1:Dendra2 (green, macrophages) and fabp10a:CFP-NTR (blue, hepatocytes) in the liver at 5 dpf. Arrows point to macrophages. (B) Confocal single-optical section images showing the expression of mpeg1:Dendra2 (green), Tp1:H2B-mCherry (red), and fabp10a:CFP-NTR (blue) in the liver at 7 dpf. Arrows point to macrophages in the control liver; arrowheads point to a macrophage engulfing a hepatocyte in tomm22 MO-injected larvae. (C) Fluorescence images showing macrophage NTR-mCherry expression before and after metronidazole (Mtz) treatment. Mtz (10 mM) was treated from 4 to 7 dpf. Note the great reduction in the number of NTR-mCherry+ macrophages in the Mtz-treated larvae at 7 dpf compared with the DMSO-treated controls. Lateral views, dorsal up, anterior to the left. Scale bar: 250 μm. (D) Scheme illustrating the period of Mtz treatment and harvest stage for macrophage ablation for (E–I). (E) Confocal single-optical section images showing the expression of Tp1:H2B-mCherry (red) and Hnf4a (gray) in the liver at 7 dpf. Arrows point to H2B-mCherry/Hnf4a double-positive cells; arrowheads point to Hnf4a single-positive cells. (F) Graph showing the percentage of H2B-mCherry− cells among Hnf4a+ cells. Red marks indicate the larvae shown in (E). (G) Confocal single-optical section images showing the expression of fabp10a:mAGFP-gmnn (green), Tp1:H2B-mCherry (red), and Hnf4a (gray) in the liver at 7 dpf. Arrows point to mAGFP-gmnn/H2B-mCherry/Hnf4a triple-positive cells; arrowheads point to mAGFP-gmnn+/H2B-mCherry−/Hnf4a+ cells. (H) Graph showing the percentage of fabp10a:mAGFP-gmnn+ cells among Hnf4a+ cells. Red marks indicate the larvae shown in (G). (I) Graph showing the percentage of H2B-mCherry+ or H2B-mCherry− proliferating Hnf4a+ cells. Red marks indicate the larvae shown in (G). n indicates the number of larvae examined. (J) Confocal single-optical section images showing the expression of WRE:d2GFP (green, Wnt activity) and Tp1:H2B-mCherry (red) in the liver at 6 dpf. Anti-GFP antibody was used to reveal WRE:d2GFP expression. Note the complete absence of hepatic d2GFP expression in the XAV939-treated, tomm22 MO-injected larvae, whereas its faint expression in macrophage-ablated, tomm22 MO-injected larvae. Scale bars: 20 μm, except (C); error bars: ±SEM. |