
|
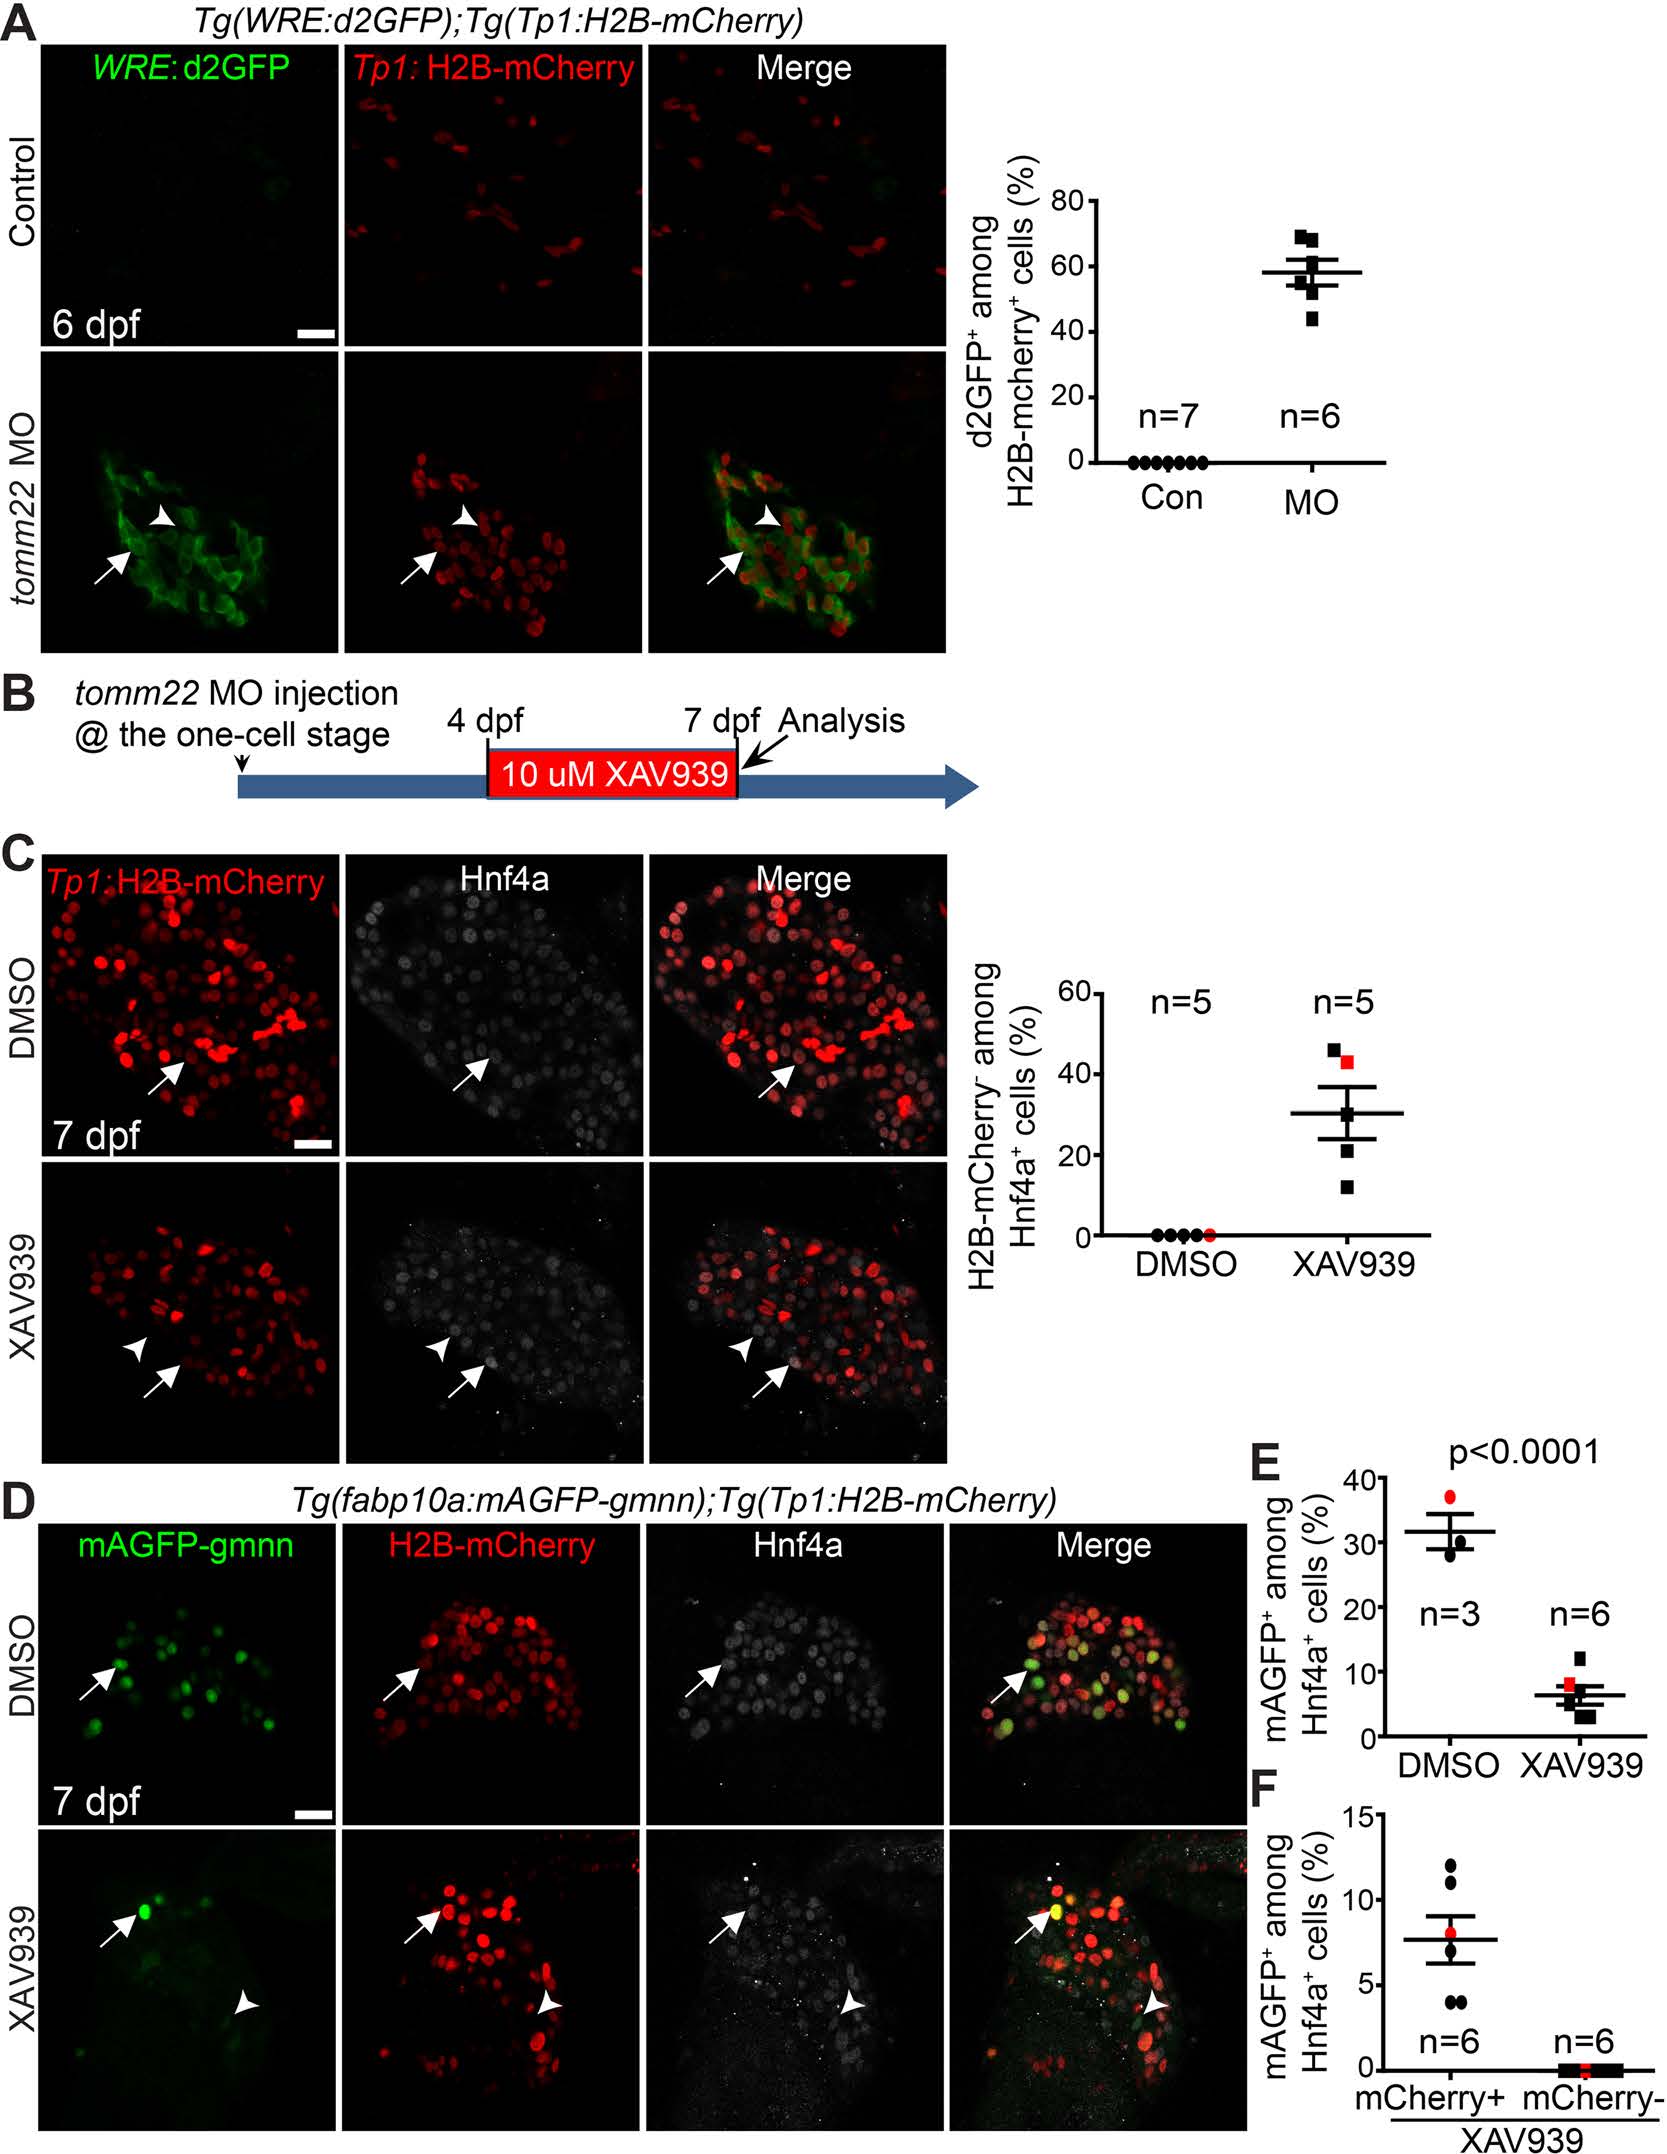
Fig. 5
Suppression of Wnt/β-catenin signaling represses hepatocyte proliferation and the formation of hybrid hepatocytes in tomm22 MO-injected larvae. (A) Confocal single-optical section images showing WRE:d2GFP (green) and Tp1:H2B-mCherry (red) expression in the liver at 6 dpf. Arrows point to d2GFP/H2B-mCherry double-positive cells; arrowheads point to H2B-mCherry single-positive cells. Quantification of the percentage of d2GFP+ cells among H2B-mCherry+ cells is shown. (B) Scheme illustrating the period of XAV939 treatment for (C)–(F). (C) Confocal single-optical section images showing the hepatic expression of Tp1:H2B-mCherry (red) and Hnf4a (gray) at 7 dpf. Arrows point to H2B-mCherry/Hnf4a double-positive cells; arrowheads point to H2B-mCherry−/Hnf4a+ cells. Quantification of the percentage of H2B-mCherry− cells among Hnf4a+ cells is shown. (D) Confocal single-optical images showing the hepatic expression of fabp10a:mAGFP-gmnn (green), Tp1:H2B-mCherry (red), and Hnf4a (gray) at 7 dpf. Arrows point to mAGFP-gmnn/H2B-mCherry/Hnf4a triple-positive cells; arrowheads point to mAGFP-gmnn/Hnf4a double-positive cells. (E) Graph showing the percentage of mAGFP-gmnn+ cells among Hnf4a+ cells. Red marks indicate the larvae shown in (D). (F) Graph showing the percentage of mCherry+ or mCherry− proliferating hepatocytes. Red marks indicate the larvae shown in (D). n indicates the number of larvae examined. Scale bars: 20 μm; error bars: ±SEM.