
- Title
-
Endoderm convergence controls subduction of the myocardial precursors during heart-tube formation
- Authors
- Ye, D., Xie, H., Hu, B., Lin, F.
- Source
- Full text @ Development
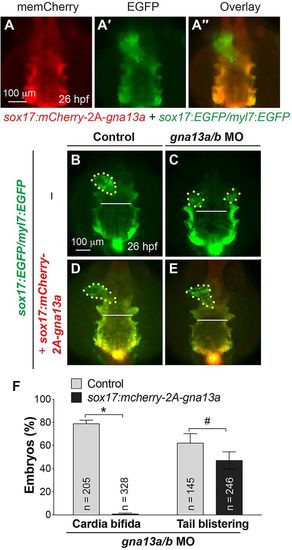
Endoderm-specific expression of Gα13 rescues defects in migration of the endoderm and myocardial cells caused by global Gα13 depletion. (A-A″) Epifluorescence images of anterior endoderm and myocardial cells in embryos indicated. (B-E) Epifluorescence images of anterior endoderm of control and gna13a/b MO-injected embryos indicated. (F) Frequencies of cardia bifida and tail blistering in embryos indicated (same as in B-E) at 2 dpf. Dorso-anterior view, with anterior up; yellow dots, cardiomyocytes; white lines (equivalent length), width of the anterior endodermal sheet. *P<0.001, #P=0.25. Data are mean±s.e.m. |

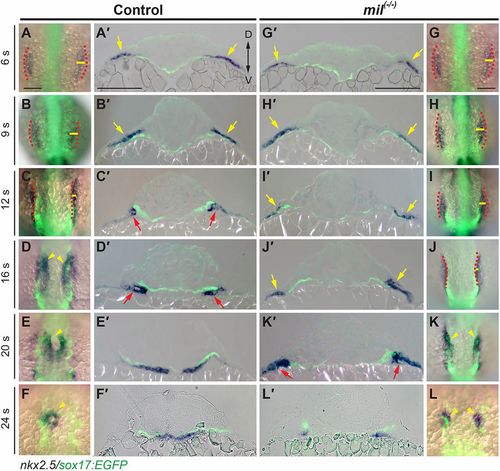
S1pr2 is required for efficient endoderm convergence during segmentation. Epifluorescence time-lapse experiments were performed on control and mil mutant embryos (supplementary material Movie 1). (A-N) Snapshots of the anterior endoderm from the movies, at the stages indicated. Dorso-anterior views; yellow lines (equivalent length for embryos at the same stage), width of the anterior endodermal sheet, showing that the endodermal sheet was wider in mutant. (O,P) The average endoderm width (O) and convergence speed (P). Red, cyan and pink lines represent the periods of rapid convergence, little convergence and expansion, respectively. Arrows and arrowheads mark completion of convergence. *P<0.05; #P<0.01 versus control. Data are mean±s.e.m. |
S1pr2 is required for the subduction and active migration of myocardial precursors. (A-L) Overlays of GFP-labeled endoderm (as revealed by immunofluorescence) and nxk2.5 expression (as revealed by whole-mount in situ hybridization), in embryos at the stages indicated. (A′-L′) Transverse sections of the embryos shown in A-L. Red dashed lines indicate lateral boundaries of the endodermal sheet; yellow lines denote width of the area covered by the myocardial populations; arrowheads indicate myocardial cells; arrows indicate that myocardial cells are located above (yellow) and below (red) the endoderm. Scale bars: 100 µm. |
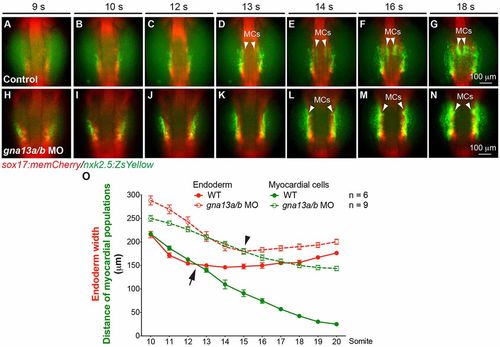
Gα13 is required for all stages of myocardial migration. Epifluorescence time-lapse experiments performed on the embryos indicated (supplementary material Movie 2). (A-N) Snapshots of the anterior endoderm and myocardial cells from the movies at the stages indicated. Dorso-anterior views. White arrowheads indicate myocardial cells (MCs). (O) Endoderm width (red) and the distance between the two populations of myocardial cells (green) at the stages indicated. Black arrow and arrowhead denote the timepoints at which myocardial precursors were dissociated from the endoderm in the control and gna13a/b MO-injected embryos, respectively. Data are mean±s.e.m. |
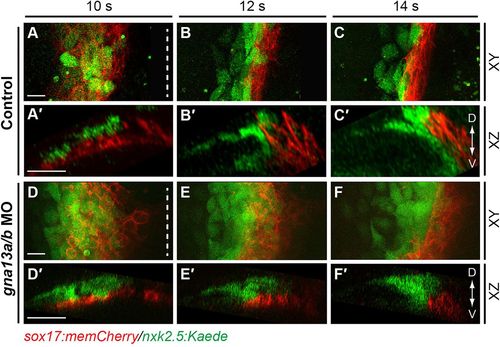
Subduction of myocardial precursors is impaired in Gα13 morphants. (A-F′) Snapshots from in toto confocal time-lapse movies of control (A-C′) or gna13a/b MO-injected (D-F′) Tg(sox17:memCherry)/(nkx2.5:Kaede) embryos at 10-14 s (supplementary material Movie 5). XY view (A-F), XZ view (A′-F′). Dashed lines denote the midline. D, dorsal; V, ventral. Scale bars: 20 µm. |
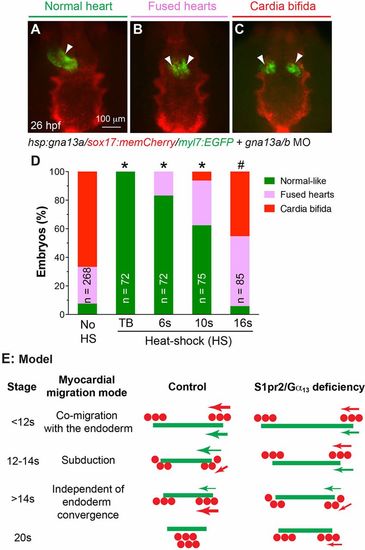
Gα13 expression prior to myocardial subduction is crucial for myocardial migration. (A-C) Classes of heart morphology phenotypes at 26 hpf, in embryos heat shocked at various stages: normal heart (A), two fused hearts (B) and two separated hearts (C). Arrowheads denote hearts. (D) Distribution of heart phenotype classes in embryos heat shocked at the indicated stages of development. The total number of embryos is indicated. *P<0.001; #P=0.8, percentage of normal-like embryos in indicated groups versus non-heat shocked group. (E) Model of how the endoderm and myocardial cells interact during heart-tube formation. The relative positions and velocities of migration of the endodermal sheet (green) and myocardial precursors (red dots) in control and S1pr2/Gα13-defective embryos at the indicated stages of myocardial-cell migration, with the mode of migration indicated. Arrow direction denotes direction of migration; arrow thickness indicates speed of migration. |
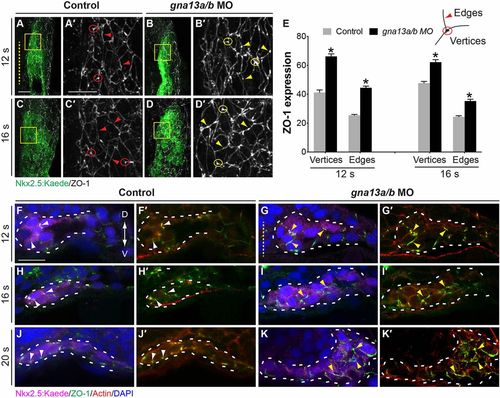
Epithelial organization of myocardial cells is disrupted in Gα13 morphants. (A-E) Whole-mount ZO-1 immunostaining was performed in embryos indicated at 12 s and 16 s. (A-D) Projections of confocal z-stacks of the right lateral mesoderm showing ZO-1 expression (gray) in the nkx2.5:Kaede-expressing (myocardial) cells (green). (A′-D′) Higher-magnification views of areas shown in boxes in A-D. The vertices were defined as regions where membranes from three adjacent cells come into contact, and the edges as the cell periphery excluding the vertices. Yellow dashed line, midline; circles, vertices; arrowheads, edges. (E) Intensity of ZO-1 expression in myocardial cells at the vertices and edges in control embryos (54 cells from 7 embryos at 12 s and 25 cells from 4 embryos at 16 s) and gna13a/b MO-injected embryos (51 cells from 8 embryos at 12 s and 20 cells from 4 embryos). *P<0.001 versus control. Data are mean±s.e.m. (F-K) Transverse vibratome sections immunostained for Kaede (magenta), ZO-1 (green), actin (Rhodamine-Phalloidin, red) and nuclei (DAPI, blue). Yellow dashed line indicates midline; white dashed lines outline myocardial cells; white and yellow arrowheads indicate normal and ectopic ZO-1 expression, respectively. Scale bars: 20 µm. |
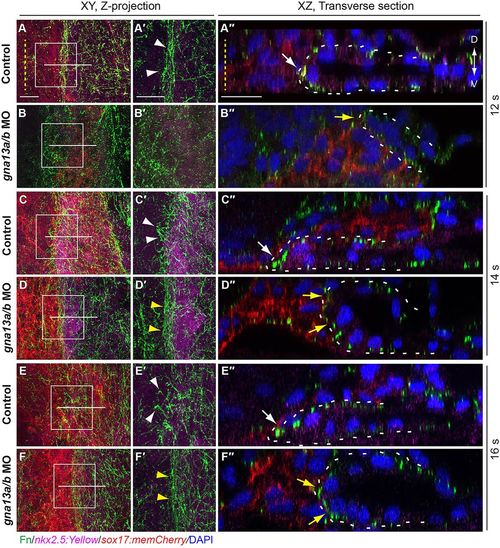
Fn assembly patterns are disrupted in Gα13 morphants. Whole-mount Fn immunostaining was performed in the embryos indicated. (A-F) Projections of XY views of confocal z-stacks spanning the myocardial cells (magenta), showing Fn assembly (green). (A′-F′) Magnification images of areas shown in boxes in A-F. White and yellow arrowheads indicate leading regions of myocardial populations in control and gna13a/b MO-injected embryos, respectively. (A″-F″) Images of XZ transverse sections of the regions indicated by white lines in A-F. White and yellow arrows indicate Fn assembly in the leading front of myocardial cells in control and gna13a/b MO-injected embryos, respectively. Yellow dashed line, midline; white dashed lines outline myocardial cells; D, dorsal; V, ventral. Scale bars: 20 µm. |
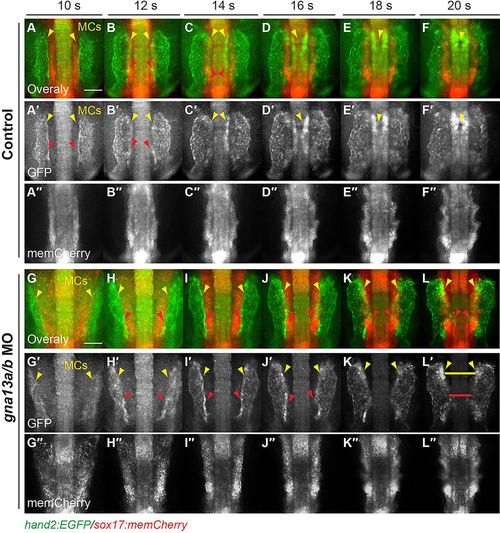
The ALPM engages in endoderm-dependent subduction. Snapshots from epifluorescence time-lapse movies of control and gna13a/b MO-injected Tg(sox17:memCherry)/(hand2:EGFP) embryos at 10-20 s (supplementary material Movie 6). Dorso-anterior views. (A-L) Overlays of anterior memCherry-labeled endoderm (red) and Hand2:GFP-labeled ALPM (green). (A′-L′) Hand2:GFP-labeled ALPM. (A″-L″) memCherry-labeled endoderm. Yellow arrowheads indicate myocardial cells (MCs); red arrowheads indicate dorsalmost region of LPM cells; yellow and red lines indicate gap between the two myocardial populations and the dorsalmost region of LPM cells. Scale bars: 100 µm. |
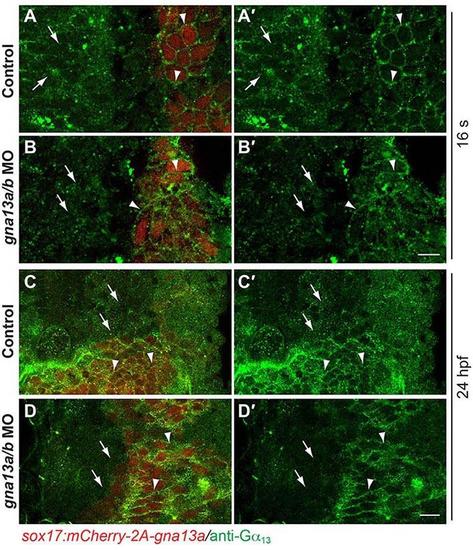
Transgenic Gα13 expression in the endoderm is resistant to injection of gna13a/b MO. Single confocal Z-planes of the anterior region of embryos in control and gna13a/b MO-injected Tg(sox17:mcherry-2A-gna13a) embryos at 16s and 24 hpf, showing Gα13 expression (green). Arrowheads: endodermal cells (red); arrows: non-endodermal cells. Scale bar: 20 μm. |
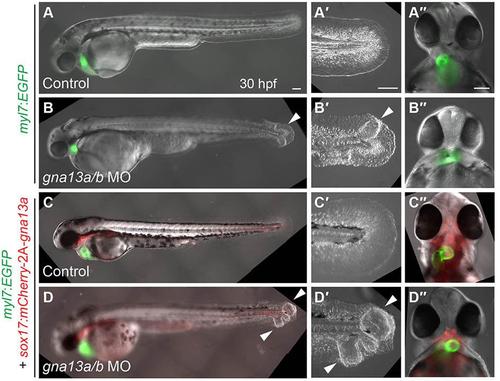
Endodermal Gα13 expression rescues cardia bifida, but not tail blistering, caused by Gα13 depletion. (A-D'') Overlays of epifluorescence and bright-field images of the indicated embryos at 30 hpf in lateral (A-D') and anterior-ventral (A''-D'') views. (A'-D') High-magnification images of the tail region of each embryo. Arrowheads: tail blisters. Scale bar: 100 μm. |
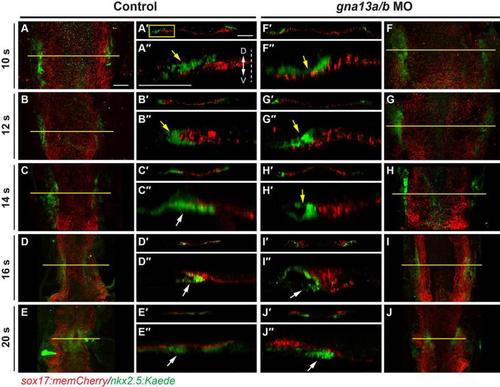
Gα13 is required for subduction and the final stage of the medial migration of myocardial precursors. (A-J) Projections of confocal Z-stacks of anterior endoderm and myocardial precursors (taken by a Lan-Apo 20×/NA 0.8 objective) in embryos at different stages as indicated, showing the mCherry-labeled endoderm (red) and Kaede-labeled myocardial cells (green). (A'-J') Images of XZ transverse sections in the areas, as indicated by yellow lines in A-J. (A''-J'') Magnified areas of the left region of the XZ transverse sections in A'-J'. Example of region used is indicated by box in A'. Dashed line: midline; arrows: myocardial cells, located above (yellow) and below (white) the endoderm; D: dorsal; V: ventral. Scale bars: 20 μm. |
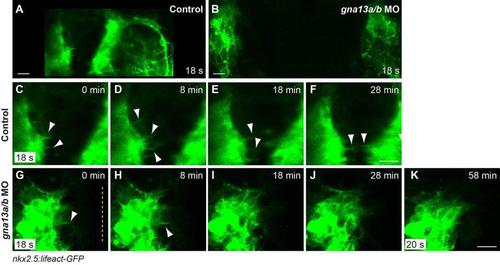
Myocardial precursors form robust migratory protrusions, which are transient in Gα13-deficient embryos. Snapshots from confocal movies of control and gna13a/b MO-injected Tg(nkx2.5:lifeact-GFP) embryos (supplementary movie 3). (A,B) The myocardial cells at 18s when the time-lapse started. (C-K) Magnified images in A-B at the indicated time-points. (C-F) The most dorsal regions of two myocardial populations in control embryos. (G-K) The left side of myocardial populations in morphants. The protrusions were presented initially, but disappeared in morphants. White arrowheads: protrusions. Yellow dashed line: midline. Scale bars: 20 μm. |
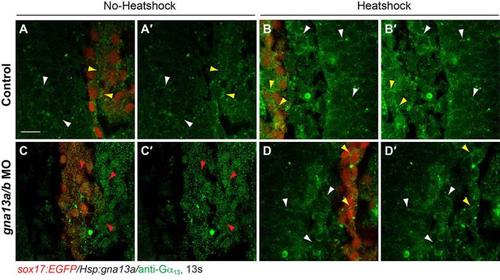
Gα13 expression in Tg(hsp:gna13a) embryos. Single confocal Z-planes of the anterior region of embryos obtained from crossing Tg(sox17:EGFP) with Tg(hsp:gna13a), showing Gα13 expression in non-endodermal cells (white arrowheads) and endodermal cells (yellow arrowheads, false red colored) in indicated embryos that were heat-shocked at 37°C for 30 minutes or left untreated in the tail-bud stage. showing Gα13 expression disappeared in gna13a/b MO-injected embryos without heat-shock (red arrowheads). Scale bar: 20 μm. |
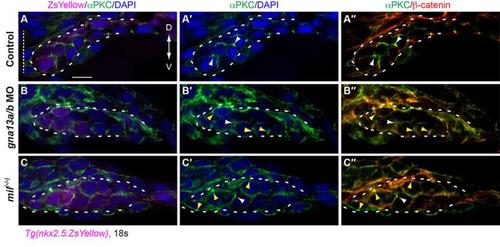
Epithelial organization of myocardial cells is disrupted in Gα13 morphants. Transverse vibratome sections immunostained with ZsYellow (Magenta), αPKC (green), β-catenin (red) and nuclei (DAPI, blue) in control (A), gna13a/b MO-injected (B) and mil mutant (C) Tg(nkx2.5:ZsYellow) embryos at 18s. Yellow dashed line: midline; white dashed lines outline myocardial cells; white arrowheads: normal αPKC expression; yellow arrowheads: ectopic αPKC expression. D: dorsal; V: ventral. |
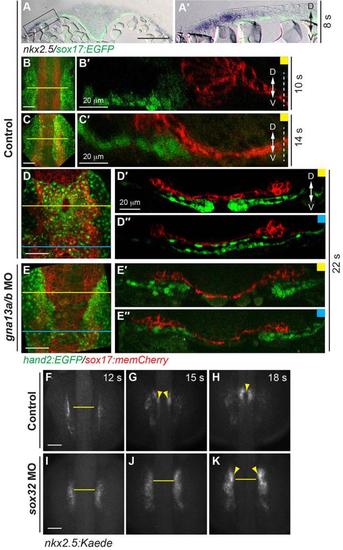
The ALPM engages in subduction, with some cells migrating from the dorsal to the ventral side of the endoderm. (A) The relative positions of the ALPM and endoderm. (A-A') Overlays of GFP (endoderm) and hand 2 expression as detected by ISH in Tg(sox17:EGFP) embryos at 8s. (A'): high-magnification image of area indicated in A. (B-E'') Confocal images of control and gna13a/b MO-injected Tg(hand2:EGFP)/Tg(sox17:memCherry) embryos at the indicated stages, showing the EGFP-expressing ALPM and memCherry-expressing endoderm. (B-E) Z-projections. Horizontal lines: positions of the XZ sections. (B'-E'') XZ views of z-stacks of embryos at positions indicated in B-E. White dashed lines: midline. D: dorsal; V: ventral. (F-K) Snapshots of myocardial precursors from epifluorescence time-lapse movies taken of control (F-H) or sox32 MO-injected (I-K) Tg(nkx2.5:Kaede) embryos at the indicated stages, using a 5x/NA 0.15 objective. Yellow arrowheads: myocardial cells; yellow lines: the distance between the two populations of myocardial cells (equivalent length). Scale bars: 100 μm, unless stated otherwise. |