
- Title
-
Spatial distribution and characterization of non-apical progenitors in the zebrafish embryo central nervous system
- Authors
- McIntosh, R., Norris, J., Clarke, J.D., Alexandre, P.
- Source
- Full text @ Open Biol.
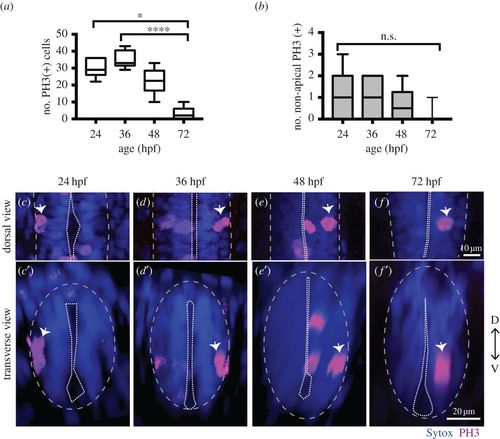
NAPs are present in the zebrafish spinal cord. (a) Quantification of all cells in mitosis in a five-somite length of a zebrafish spinal cord at 24, 36, 48, 72 hpf. Data shown as a box-and-whisker plot with the line inside the box representing the mean and whiskers representing minimum and maximum values. The sample size is indicated in the text. Data analysed using Kruskal–Wallis (***p = 0.0001) with Dunn's multiple comparison test (****p < 0.0001, *p = 0.01). (b) Quantification of mitoses in non-apical locations in a five-somite length of a zebrafish spinal cord at 24, 36, 48, 72 hpf. Data shown as a box-and-whisker plot with the line inside the box representing the mean and whiskers representing minimum and maximum values. The sample size is indicated in the text. The number of non-apical mitoses does not vary significantly through embryonic development (Kruskal–Wallis, p > 0.05) and are rare at 72 hpf. (c–f) Neural progenitor mitoses revealed by PH3 staining (magenta, indicated by white arrows) in non-apical locations in zebrafish spinal cord at (c,c′) 24 hpf, (d,d′) 36 hpf, (e,e′) 48 hpf and (f,f′) 72 hpf. Tissue is counterstained with nuclei marker (Sytox, in blue). (c–f) Single z-slices of dorsal views and (c′–f′) transverse reconstructions. The grey and white dashed lines outline the basal and apical surfaces of the neuroepithelia, respectively. |
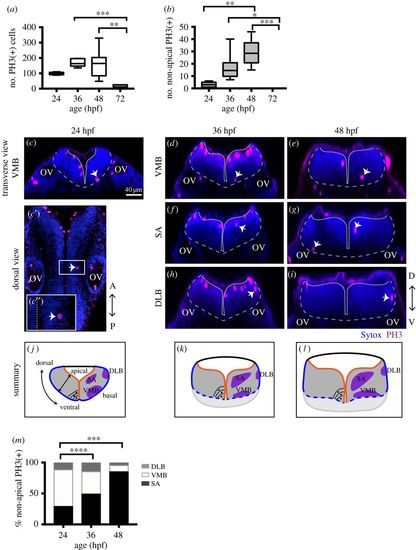
NAPs are restricted to specific regions in the developing hindbrain. (a) Quantification of all cells in mitosis in the zebrafish hindbrain at 24, 36, 48, 72 hpf. Data shown as a box-and-whisker plot with the line inside the box representing the mean and whiskers representing minimum and maximum values. The sample size is indicated in the text. Total number of cells in mitosis in the hindbrain (in apical and non-apical locations) decreases significantly at 72 hpf. Data analysed using Kruskal–Wallis (***p = 0.0006) with Dunn's multiple comparison test (**p = 0.0075, ***p = 0.0007). (b) Quantification of mitoses in non-apical locations in the zebrafish hindbrain at 24, 36, 48, 72 hpf. Data shown as a box-and-whisker plot with the line inside the box representing the mean and whiskers representing minimum and maximum values. The sample size is indicated in the text. The proportion of non-apical divisions in the hindbrain significantly increases between 24 and 48 hpf, but they are absent at 72 hpf. Data analysed using Kruskal–Wallis (****p < 0.0001) with Dunn's multiple comparison test (*p = 0.0124, **p = 0.0038,***p = 0.0002). (c–i) Neural progenitor mitoses revealed by PH3 staining (magenta, indicated by white arrows) in non-apical locations in zebrafish hindbrain at (c–c″) 24 hpf, (d,f,h) 36 hpf and (e,g,i) 48 hpf. Tissue is counterstained with nuclei marker (Sytox, in blue). (c′,c″) Single z-slice of a dorsal view of zebrafish hindbrain at low magnification; in (c′) a white arrow indicates an NAP mitosis, in (c″) higher magnification of white box in (c′). (c,d–i) Transverse optical sections of the zebrafish hindbrain show the position of NAP mitoses along the dorsoventral and mediolateral axis at (c–c″) 24 hpf, (d,f,h) 36 hpf and (e,g,i) 48 hpf. (c–i) At 24, 36 and 48 hpf NAP mitoses can occur in (c,d,e) ventral medial basal (VMB), (f,g) subapical (SA) and (h,i) dorsolateral basal (DLB) regions of the hindbrain neuroepithelium. Observations are summarized in (j–l). (m) The relative proportions of VMB, SA, DLB NAPs populations in the hindbrain at 24, 36 and 48 hpf are shown in the stacked bar diagram. Data analysed using a χ2 test (****p = 0.0001, ***p = 0.0006). In (c,c″,d–i) the basal and apical surfaces of the neuroepithelia are outlined by grey and white dashed lines respectively. OV, otic vesicle; A-P, antero-posterior; D-V, dorsoventral axis. |

(a) Quantification of all cells in mitosis in the zebrafish telencephalon at 24, 36, 48, 72 hpf. Data shown as a box-and-whisker plot with the line inside the box representing the mean, and whiskers representing minimum and maximum values. The sample size is indicated in the text. The number of cells in mitosis increases significantly at 36 hpf. Data analysed using Kruskal–Wallis (***p = 0.0004) with Dunn's multiple comparison test (p = 0.0002). (b) Quantification of all cells in mitosis in the zebrafish telencephalon at 24, 36, 48, 72 hpf. Data shown as a box-and-whisker plot with the line inside the box representing the mean and whiskers representing minimum and maximum values. The sample size is indicated in the text. The number of NAP mitoses does not vary significantly from 24 to 72 hpf. Data analysed using Kruskal–Wallis (p = 0.18). (c–f) Neural progenitor mitoses revealed by PH3 staining (magenta, indicated by white arrows) in non-apical locations of zebrafish telencephalon at (c) 24 hpf, (d) 36 hpf, (e) 48 hpf, (f) 72 hpf. Tissue is counterstained with nuclei marker (Sytox, in blue). Images are single z-slices of a transverse view of zebrafish telencephalon at (c) 24 hpf, (d) 36 hpf, (e) 48 hpf, (f) 72 hpf. Green arrows in (d) indicate clusters of mitoses in hypothalamic territory that were not analysed. A white dash line outlines apical surface or ventricle of zebrafish telencephalon. OE, olfactory epithelium. |
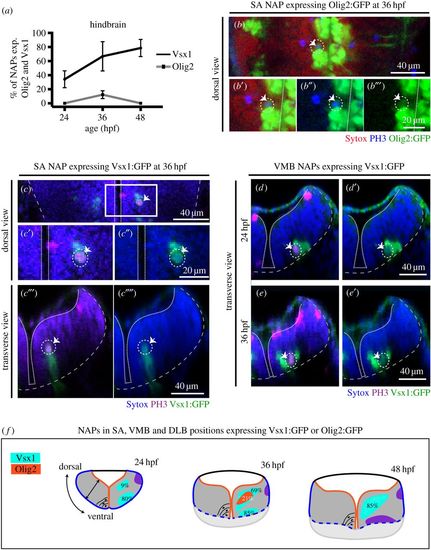
Vsx1 and Olig2 are expressed by distinct subpopulations of NAPs in zebrafish developing hindbrain. (a) Quantification of non-apical mitoses expressing Vsx1:GFP and Olig2:GFP in hindbrain at 24, 36, 48 hpf. (b–b″) Single z-slice of a dorsal view of hindbrain at 36 hpf showing NAP in mitosis in SA position expressing Olig2:GFP (indicated by a dashed circle and white arrow). (c–c′′′′) Single z-slice of a dorsal (c–c″) and transverse (c′″,c′′′′) views of hindbrain at 36 hpf, showing NAP in mitosis in SA position expressing Vsx1:GFP (indicated by a dashed circle and white arrow). (d–e′) Transverse hindbrain sections at 24 and 36 hpf showing NAPs in mitosis in VMB positions expressing Vsx1:GFP (indicated by a dashed circle and white arrow). (f) Quantification of NAPs in SA, VMB and DLB positions in the zebrafish hindbrain, expressing Olig2:GFP and Vsx1:GFP at 24, 36 and 48 hpf. Magenta (blue in (b–b′″)) is PH3 staining and blue (red in (b–b′″)) is Sytox nuclear counter stain. The grey and white dashed lines outline the basal and apical surfaces of the neuroepithelia, respectively. |
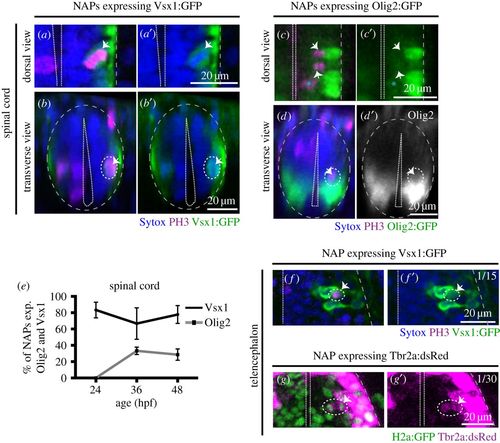
Vsx1, Olig2 and Tbr2 are expressed by subpopulations of NAPs in zebrafish spinal cord and telencephalon. (a,a′) Horizontal and (b,b′) transverse sections of spinal NAP in mitosis (white arrow) expressing Vsx1:GFP at 36 hpf. (c,c′) Horizontal and (d,d′) transverse section of spinal cord with a NAPs in mitosis (white arrow) expressing low levels of Olig2:GFP at 36 hpf. (e) Quantification of non-apical mitoses expressing Vsx1:GFP (black) or Olig2:GFP (grey) in spinal cord at 24, 36, 48 hpf. (f,f′) Single z-slice of NAP in mitosis (white arrow) expressing Vsx1:GFP in the telencephalon at 24 hpf. (g,g′) Single z-slice of NAP in mitosis (white arrow) expressing Tbr2a:dsRed in the telencephalon at 24 hpf. Green labels cell nuclei and magenta labels Tbr2 transgene. In (a–f′), magenta is PH3 staining and blue is Sytox nuclear counter stain. The grey and white dashed lines outline the basal and apical surfaces of the neuroepithelia, respectively. |
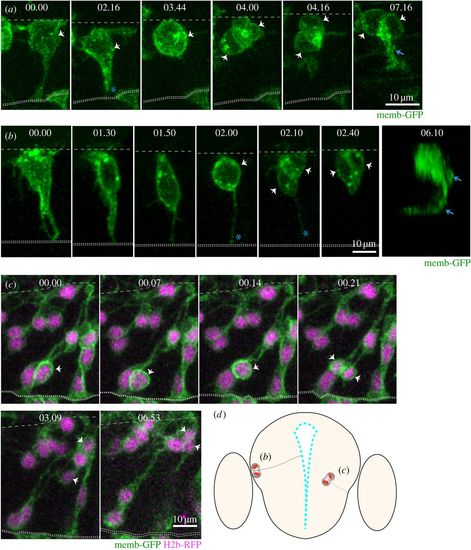
Live imaging reveals distinct behaviours of NAPs in zebrafish CNS (time points shown in hours and minutes). (a) Images from confocal time-lapse showing NAP dividing at the basal surface of the neuroepithelium in the spinal cord and generating two daughter neurons at 24 hpf. The NAP loses apical contact prior to division. White arrows in time points 03.44 and 04.00 indicate the dividing NAP and then its two daughter cells. The basal and apical surfaces of the neural tube are outlined by dashed lines at the top and bottom of this time sequence, respectively. An axon is evident (blue arrow) by time point 07.16. (b) Images from confocal time-lapse showing NAP dividing at the basal surface of telencephalic neuroepithelium (white arrow in time point 02.00) at 24 hpf and generating two daughter cells (white arrows in time points 02.10 and 02.40) that will become neurons. A three-dimensional reconstruction of the image at time point 06.10 shows that two axons have been formed (blue arrows). This NAP retains the apical attachment during mitosis but releases the apical surface soon after division (blue asterisk in time points 02.00 and 02.10). Basal surface shown by dashed line at top of the image and apical surface shown by two dotted lines at bottom. (c) Images from confocal time-lapse showing NAP dividing in a subapical position of telencephalic neuroepithelium at 30 hpf (white arrows in time points 00.14 and 00.21). This division generates two daughter cells that adopt a round shape and move basally into neuronal mantle layer (white arrows in time points 03.09 and 06.53). This NAP does not retain the apical contact during division. A diagrammatic transverse section of the telencephalon is shown in (d) to illustrate location of NAP mitoses shown in (b) and (c). All images are projected images from confocal z-stacks. |
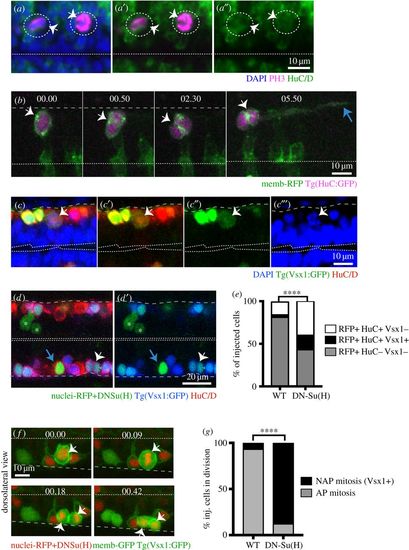
NAPs and neurons share similar molecular mechanisms. (a–a″) Two NAPs (PH3+, magenta) divide away from the apical surface of the hindbrain and express the neuronal marker HuC/D (green). PH3 and HuC/D have been detected by immunohistochemistry while the overall tissue has been counterstained with nuclei marker (Sytox, in blue). Dotted circles and white arrows indicate the dividing progenitors. Dashed line at the bottom of image indicates apical surface. (b) Time-lapse sequence from projected confocal stack shows NAP in spinal cord expressing membrane-RFP (green) and Tg(HuC:GFP) (magenta) while undergoing mitosis (white arrow at time point 00.00 and 00.50) at basal surface of neuroepithelium. Later (at 5h50) the two daughter cells elongate axons (blue arrow) confirming the neuronal fate. Dashed line at the bottom of image indicates apical surface. (b,f) Time points shown in hours and minutes. (c–c′″) NAPs in the spinal cord expressing Vsx1 (Vsx1:GFP+, green) express the neuronal marker HuC/D (red) during mitosis as indicated by the white arrows. The dividing cell at top of the image is in prophase. HuC/D has been detected by immunohistochemistry and tissue counterstained with nuclei marker (Sytox, in blue). Single confocal slice from dorsal view of spinal cord. Double dashed line at the bottom of image indicates apical surface. (d–e) Mosaic overexpression of Dn-Su(H) (green labelled cells) in the spinal cord increases Vsx1 expressing (Vsx1+) NAP population (white arrows in (d) and (d′)). Cells expressing nuclear-RFP alone (control) or with Dn-Su(H) mRNAs ((d,d′) in green) can be neuronal NAPs derived (HuC/D+ and Vsx1:GFP, triple labelled in green/blue/red, indicated by white arrow), neuronal non-NAPs derived (HuC/D+ but Vsx1:GFP-, double labelled in green/red, indicated by blue arrow), non-neuronal cells (neuronal progenitors) (Vsx1:GFP- and HuC/D-, labelled in green, indicated by white asterisks). (e) The relative proportions of these distinct cell populations in control or Dn-Su(H) expressing embryos are shown in the stack bar diagram and reveal an increase in neuronal cell types (NAPs (RFP+/HuC/D+/Vsx1+) and non-NAPs (RFP+/HuC/D+/Vsx1-) derived) at the expense of non-neuronal cell types (progenitors (RFP+/HuC/D-/Vsx1-)). Data analysed using a χ2 test (****p < 0.0001). (f) Image sequence showing a dividing NAP expressing membrane-GFP, nuclei-RFP, DN-Su(H) and Vsx1:GFP in zebrafish spinal cord (white arrows). Apical surface shown by white dashed line at top of the image and basal surface shown by grey dashed line at bottom. (g) The relative proportions of mitoses occurring at the apical (AP mitosis) and non-apical (NAP mitosis/Vsx1+) locations in the spinal cord of control and DN-Su(H) expressing embryos are shown in the stack bar diagram. (f–g) Cells expressing DNSu(H) (image sequence in (f)) preferentially divide in non-apical positions and express Vsx1:GFP. (g) Data analysed using a χ2 test (****p < 0.0001). |