
Fig. 6
- ID
- ZDB-FIG-170308-24
- Publication
- McIntosh et al., 2017 - Spatial distribution and characterization of non-apical progenitors in the zebrafish embryo central nervous system
- Other Figures
- All Figure Page
- Back to All Figure Page
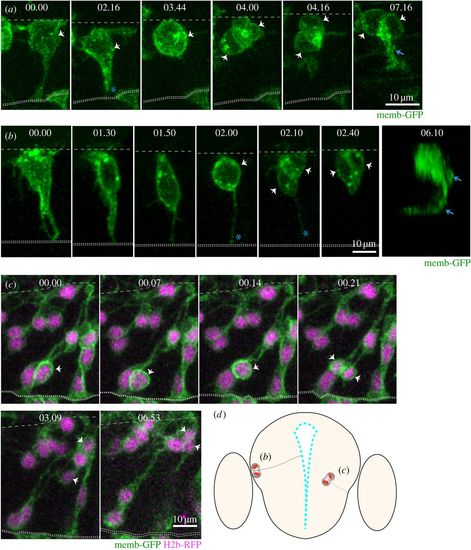
Live imaging reveals distinct behaviours of NAPs in zebrafish CNS (time points shown in hours and minutes). (a) Images from confocal time-lapse showing NAP dividing at the basal surface of the neuroepithelium in the spinal cord and generating two daughter neurons at 24 hpf. The NAP loses apical contact prior to division. White arrows in time points 03.44 and 04.00 indicate the dividing NAP and then its two daughter cells. The basal and apical surfaces of the neural tube are outlined by dashed lines at the top and bottom of this time sequence, respectively. An axon is evident (blue arrow) by time point 07.16. (b) Images from confocal time-lapse showing NAP dividing at the basal surface of telencephalic neuroepithelium (white arrow in time point 02.00) at 24 hpf and generating two daughter cells (white arrows in time points 02.10 and 02.40) that will become neurons. A three-dimensional reconstruction of the image at time point 06.10 shows that two axons have been formed (blue arrows). This NAP retains the apical attachment during mitosis but releases the apical surface soon after division (blue asterisk in time points 02.00 and 02.10). Basal surface shown by dashed line at top of the image and apical surface shown by two dotted lines at bottom. (c) Images from confocal time-lapse showing NAP dividing in a subapical position of telencephalic neuroepithelium at 30 hpf (white arrows in time points 00.14 and 00.21). This division generates two daughter cells that adopt a round shape and move basally into neuronal mantle layer (white arrows in time points 03.09 and 06.53). This NAP does not retain the apical contact during division. A diagrammatic transverse section of the telencephalon is shown in (d) to illustrate location of NAP mitoses shown in (b) and (c). All images are projected images from confocal z-stacks. |