
Fig. 1
- ID
- ZDB-FIG-170308-19
- Publication
- McIntosh et al., 2017 - Spatial distribution and characterization of non-apical progenitors in the zebrafish embryo central nervous system
- Other Figures
- All Figure Page
- Back to All Figure Page
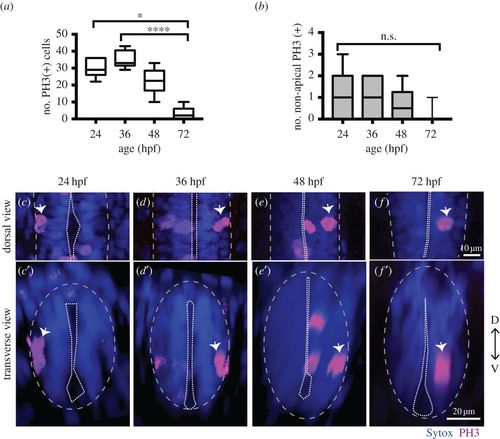
NAPs are present in the zebrafish spinal cord. (a) Quantification of all cells in mitosis in a five-somite length of a zebrafish spinal cord at 24, 36, 48, 72 hpf. Data shown as a box-and-whisker plot with the line inside the box representing the mean and whiskers representing minimum and maximum values. The sample size is indicated in the text. Data analysed using Kruskal–Wallis (***p = 0.0001) with Dunn's multiple comparison test (****p < 0.0001, *p = 0.01). (b) Quantification of mitoses in non-apical locations in a five-somite length of a zebrafish spinal cord at 24, 36, 48, 72 hpf. Data shown as a box-and-whisker plot with the line inside the box representing the mean and whiskers representing minimum and maximum values. The sample size is indicated in the text. The number of non-apical mitoses does not vary significantly through embryonic development (Kruskal–Wallis, p > 0.05) and are rare at 72 hpf. (c–f) Neural progenitor mitoses revealed by PH3 staining (magenta, indicated by white arrows) in non-apical locations in zebrafish spinal cord at (c,c′) 24 hpf, (d,d′) 36 hpf, (e,e′) 48 hpf and (f,f′) 72 hpf. Tissue is counterstained with nuclei marker (Sytox, in blue). (c–f) Single z-slices of dorsal views and (c′–f′) transverse reconstructions. The grey and white dashed lines outline the basal and apical surfaces of the neuroepithelia, respectively. |